

The video explains the execution process of a Java program, detailing where objects are created, when they qualify for garbage collection, and the storage of threads. It also clarifies the differences between Stack and Heap memory. Viewers can gain a deeper understanding of these concepts through the video.

The ConFoo.CA Developer Conference, held virtually in 2021, featured over 100 presentations by international speakers, focusing on practical software solutions. Architect Ram Lakshmanan discussed "7 JVM Arguments of Highly Effective Applications," highlighting key JVM arguments that enhance application performance, amidst the overwhelming 600+ arguments related to garbage collection and memory.

This article on chaos engineering demonstrates how to simulate a CPU spike to 100% using an infinite loop in a Java program with multiple threads. It discusses monitoring CPU consumption using the UNIX tool 'top' and suggests manual and automated root cause analysis methods, highlighting the yCrash tool's effectiveness in identifying the source of the issue.
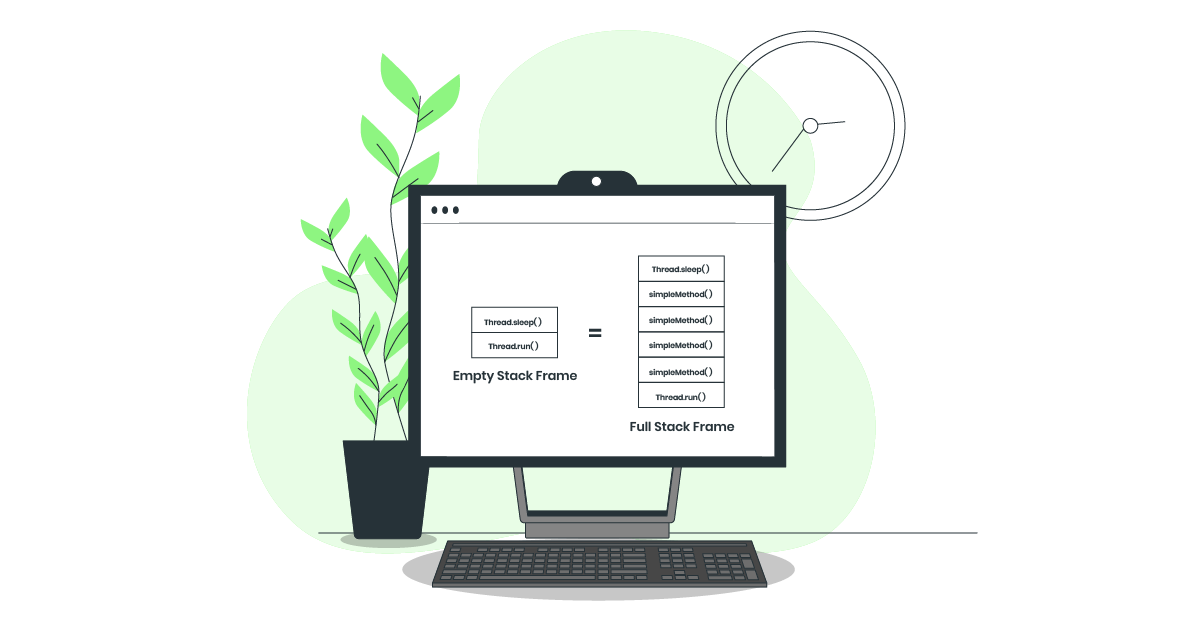
In a study comparing memory consumption of Java threads, both dormant and active threads were found to consume the same memory, regardless of their activity level. The findings suggest that memory allocation occurs at thread creation, not based on usage, highlighting the importance of optimizing thread count and stack size in Java applications to reduce wasteful memory usage.

The Java Virtual Machine (JVM) generates three key artifacts for performance optimization: Garbage Collection (GC) logs, Thread dumps, and Heap dumps. GC logs track memory management events, Thread dumps capture current thread states, and Heap dumps provide snapshots of memory. Each has specific uses in troubleshooting and performance analysis.

The health check status page provides diagnostic information about the application and JVM, including memory usage, operating system details, class loading, and threading metrics. Accessible via a specified URL, users can view data in a formatted or raw JSON format, which aids in diagnosing application performance and health.

Thread dumps are essential for diagnosing performance issues in applications, often spanning hundreds of lines. Condensing this data into a flame graph simplifies analysis. The article outlines generating flame graphs from Java or JVM languages by capturing thread dumps using jstack and analyzing them with the fastThread tool. Flame graphs enhance code visualization.

Thread dumps are essential for diagnosing production issues. This article introduces an additional troubleshooting pattern and outlines various methods to capture thread dumps. Analyzing thread dumps for Exceptions or Errors is crucial, as demonstrated by a java.lang.OutOfMemoryError case. Tools like fastThread can assist in identifying problematic threads efficiently.

Threads that throw exceptions, like java.lang.OutOfMemoryError, should be examined for the source of issues. In this case, insufficient memory allocated for processing large XML payloads led to the error. Increasing the memory allocation resolved the problem, highlighting the importance of investigating exceptions in thread dumps for troubleshooting application issues.