


Java thread dump analysis is the art of precision—a journey that leads to uncovering the most elusive issues within your Java applications. In this world of intricate threads and complex code, fastThread’s ‘My Patterns’ feature shines as your friendly companion.
What ‘My Patterns’ Aims to Achieve?
At its core, ‘My Patterns’ is your gateway to precision. It’s your tool for defining, refining, and customizing your thread dump analysis with a level of accuracy that was once reserved for the experts. Here’s what ‘My Patterns’ aims to achieve:
Customized Thread Identification: ‘My Patterns’ empowers you to create custom patterns that define specific thread stack trace structures or sequences. These patterns are the key to focusing your analysis on exactly what matters to you. Think of them as your precision lenses.
Effortless Management: Whether you’re creating, naming, or saving patterns, ‘My Patterns’ streamlines every step of the process. It eliminates the manual effort required to sift through extensive thread dump reports, making your analysis efficient and hassle-free.
Proactive Troubleshooting: With custom patterns, you can proactively monitor your Java applications. By defining patterns that represent normal behavior, you can instantly detect deviations and potential issues as they arise, putting you one step ahead in troubleshooting.
Creating and Managing Custom Patterns with ‘My Patterns’
‘Manage Patterns’ Page: To create and manage custom patterns, start by going to the ‘My Patterns’ section within the fastThread report page. Once in the ‘My Patterns’ section, click on the ‘Manage Patterns’ button. This action will take you to the ‘Manage Patterns’ page.

Defining Custom Patterns: Once on the ‘Manage Patterns’ page, the process of creating custom patterns becomes straightforward and powerful. Custom patterns allow you to define specific thread stack trace structures or sequences relevant to your analysis.
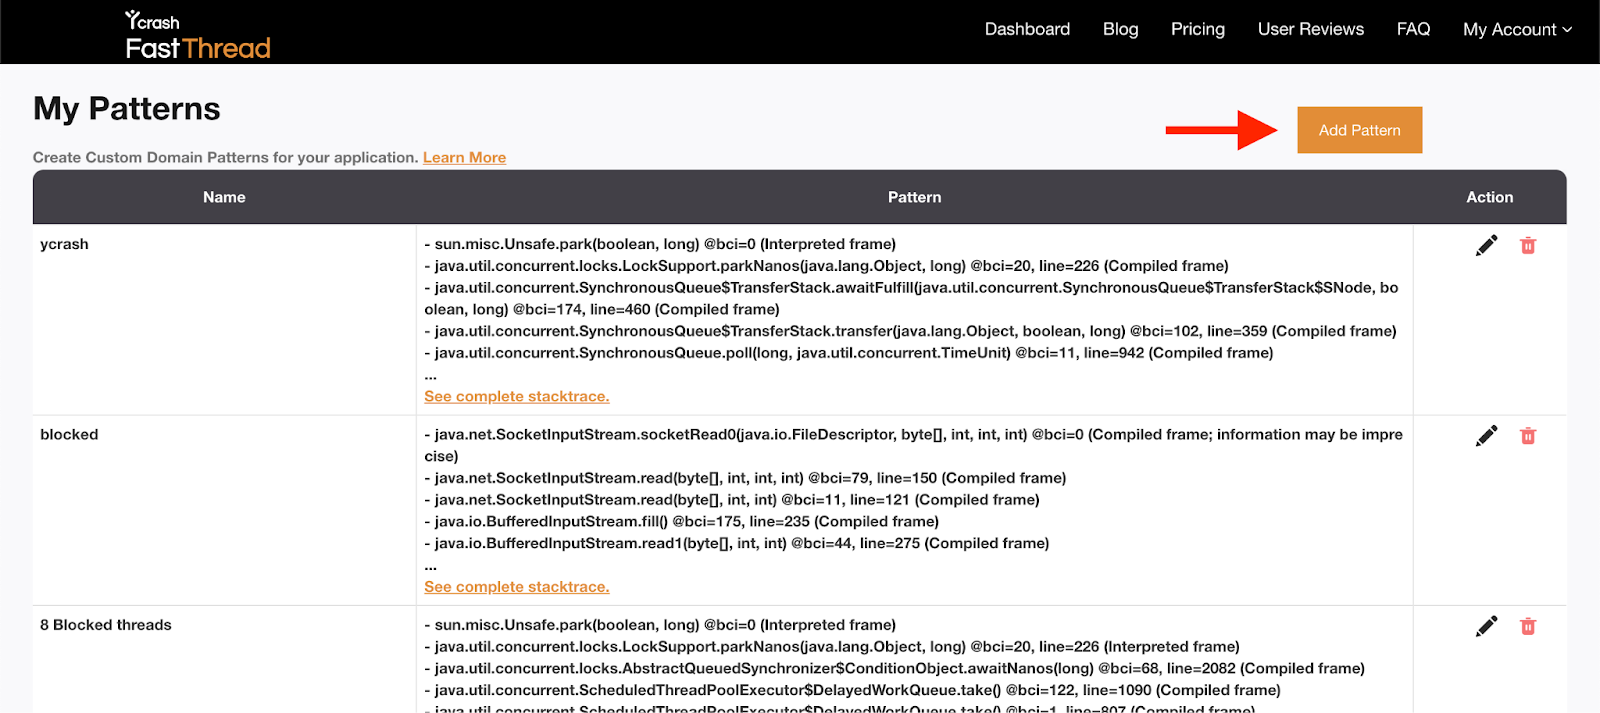
- Define Stacktrace lines: Click on the ‘Add Pattern’ button on the right top corner of the page, to create a custom pattern by specifying the thread stacktrace lines you want to match in your analysis. This can include specific classes, methods, keywords, or any other elements pertinent to your analysis goals. For example, you can define a pattern to identify threads related to a critical database connection pool or threads associated with a particular module of your application.

- Name Your Pattern: Assign a clear and descriptive name to your custom pattern. This name should make it easy to identify the pattern when managing your collection. A well-chosen name can save you time when you have multiple patterns to work with.

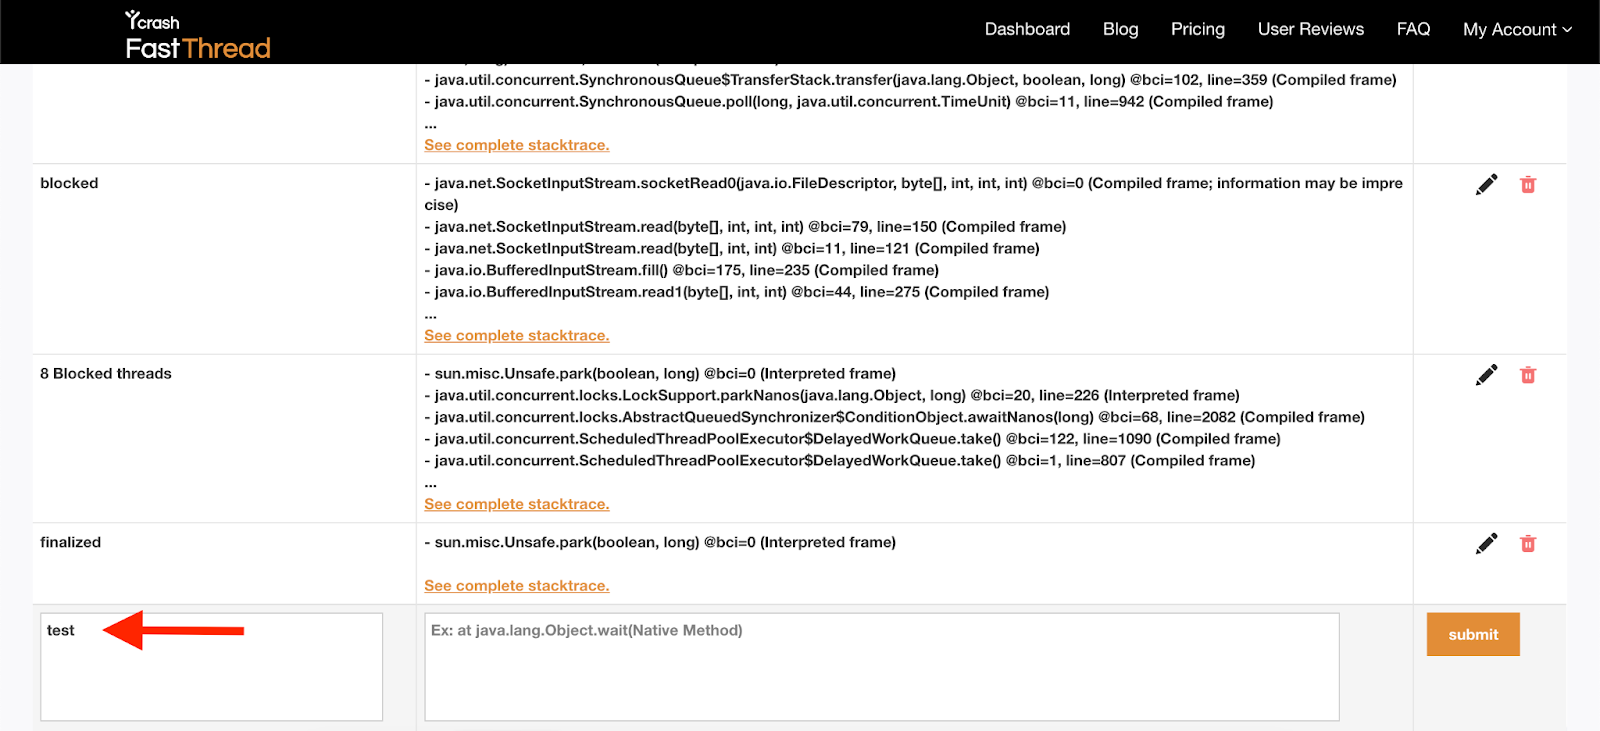
- Save Your Pattern: After defining the structure and naming your custom pattern, save it. Your pattern is now ready to be applied during thread dump analysis.
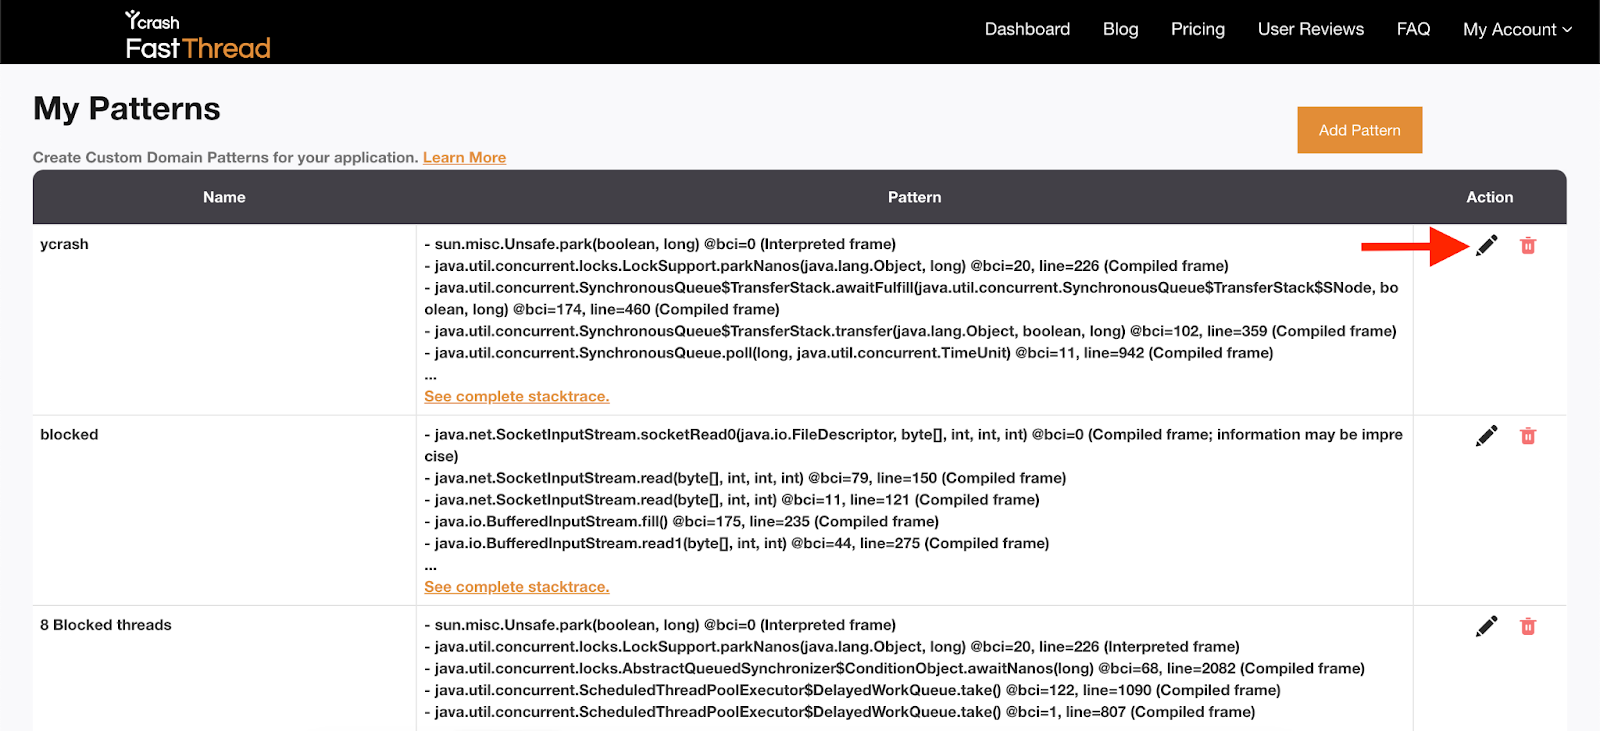
- Edit Patterns: Easily make changes to an existing pattern by clicking on the ‘Edit’ icon in the Patterns table. Whether it’s refining the stacktrace lines or updating the name of the pattern, editing is a breeze.
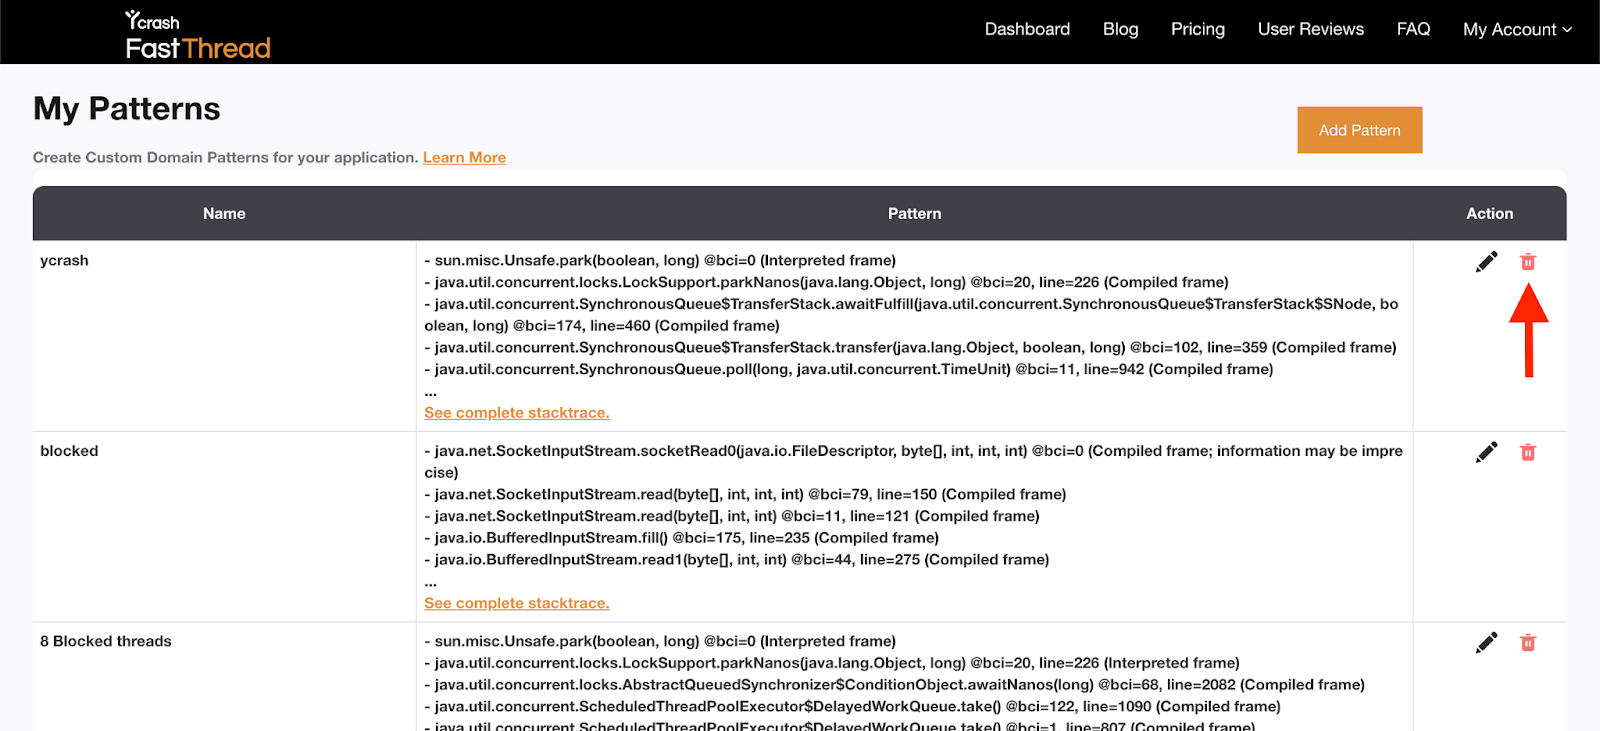
- Delete Patterns: Remove patterns that are no longer relevant or necessary from your collection by clicking on the ‘Delete’ icon. This ensures that your ‘My Patterns’ workspace remains organized and focused on the patterns essential to your analysis.
Analyzing Thread Dumps with ‘My Patterns’ and Visualizing Matches
Once you’ve defined your custom patterns, all the patterns are automatically applied to the thread dump you’re analyzing. ‘My Patterns’ section presents you with a visual representation of the matched threads in a table format.
Matching Threads: Each matching thread name is a clickable hyperlink. When you click on a thread name, a pop-up modal appears on the same page, displaying the stack trace of that specific thread.
Pattern Highlights: In the stacktrace view, the portions of the stacktrace that match your custom patterns are highlighted with a bright yellow color. This not only draws your attention to the relevant information but also makes it easier to identify the exact points where your patterns match.
Conclusion
fastThread’s ‘My Patterns’ feature represents a significant leap in precision for Java thread dump analysis. By effortlessly creating, applying, and visualizing custom patterns, it streamlines the troubleshooting process. The visual cues, such as highlighted matches and clickable thread names, provide clarity and efficiency in your analysis.
In real-world scenarios, ‘My Patterns’ has proven to expedite issue resolution and enhance application performance. It’s your go-to tool for proactive monitoring and precise troubleshooting. Experience the transformation for yourself. Start simplifying your analysis with ‘My Patterns’ in fastThread today.