
The application connecting to the Oracle RAC cluster experienced performance issues due to resource constraints, causing unresponsiveness. Troubleshooting artifacts were collected and analyzed using yCrash, revealing that 46% of threads were blocked waiting for database responses. After escalating to the DBA, resource adjustments resolved the slowdown, restoring normal application function.

Apache PDFBox is an open-source library for handling PDF documents in Java. A recent deadlock issue was identified in the library, which occurs when two threads are blocked, waiting for resources held by each other. The problem was diagnosed using a thread dump, and a ticket was filed, resulting in a prompt fix by the PDFBox team.

The post discusses troubleshooting intermittent HTTP 502 Bad Gateway errors in an application running on AWS Elastic Beanstalk. The errors were traced to the Tomcat server, which was terminated due to insufficient RAM (1GB). Upgrading to a 2GB RAM EC2 instance resolved the issue, eliminating the errors.

The post discusses c1 and c2 compiler threads in Java, which optimize application performance but may lead to high CPU consumption. It explains the differences between client and server JIT compilers, default thread counts, and provides solutions for managing high CPU usage, including JVM arguments to adjust compilation levels and thread counts.

On October 11, 2021, GCeasy experienced an outage due to HTTP 504 errors caused by inefficiencies in a new SQL query from a recent deployment. AWS CloudWatch monitored CPU and database connection spikes, while yCrash identified the problematic code. Commenting out the SQL query restored application performance.

This article on chaos engineering demonstrates how to simulate a CPU spike to 100% using an infinite loop in a Java program with multiple threads. It discusses monitoring CPU consumption using the UNIX tool 'top' and suggests manual and automated root cause analysis methods, highlighting the yCrash tool's effectiveness in identifying the source of the issue.
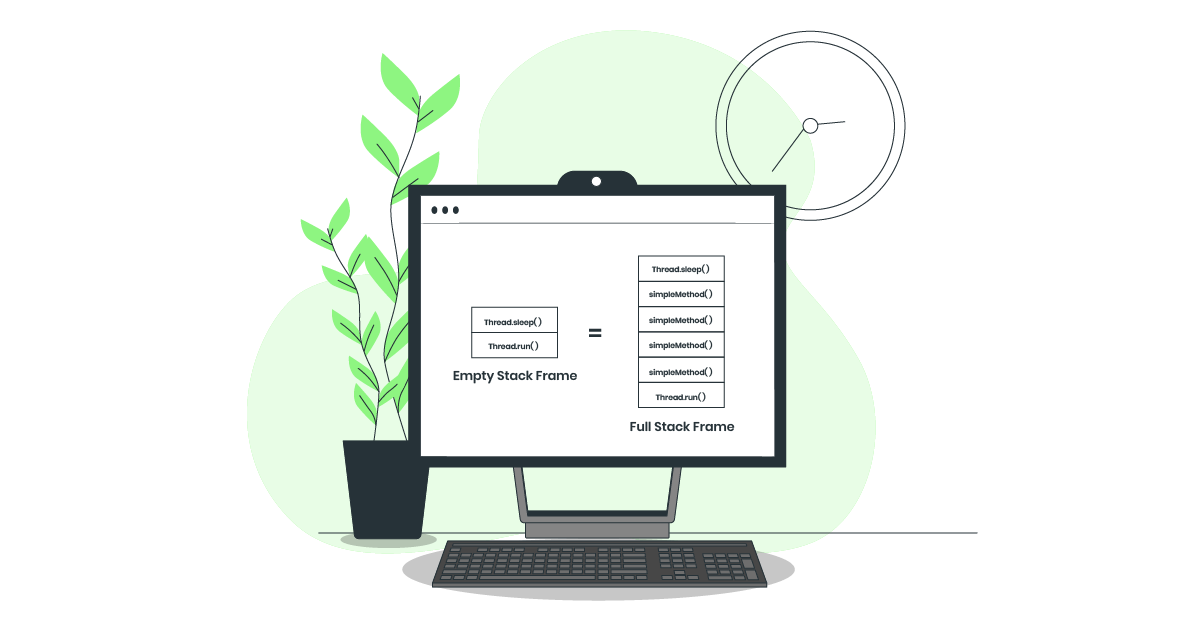
In a study comparing memory consumption of Java threads, both dormant and active threads were found to consume the same memory, regardless of their activity level. The findings suggest that memory allocation occurs at thread creation, not based on usage, highlighting the importance of optimizing thread count and stack size in Java applications to reduce wasteful memory usage.

Threads that throw exceptions, like java.lang.OutOfMemoryError, should be examined for the source of issues. In this case, insufficient memory allocated for processing large XML payloads led to the error. Increasing the memory allocation resolved the problem, highlighting the importance of investigating exceptions in thread dumps for troubleshooting application issues.

The article discusses merging thread dump and top -H output to analyze CPU spike issues in applications. It outlines steps for capturing these data types, using the FastThread tool for analysis, and highlights the benefits through a case study from a trading application. Automation via REST API is also mentioned for efficiency.