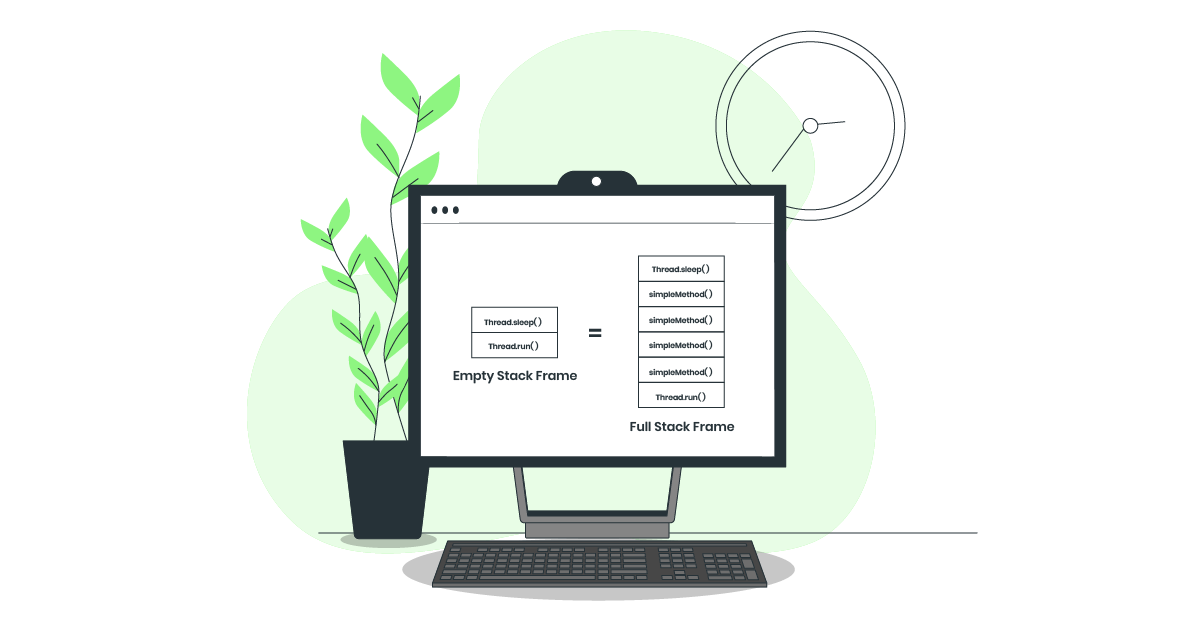
In a study comparing memory consumption of Java threads, both dormant and active threads were found to consume the same memory, regardless of their activity level. The findings suggest that memory allocation occurs at thread creation, not based on usage, highlighting the importance of optimizing thread count and stack size in Java applications to reduce wasteful memory usage.

Thread dumps are essential for diagnosing production issues. This article introduces an additional troubleshooting pattern and outlines various methods to capture thread dumps. Analyzing thread dumps for Exceptions or Errors is crucial, as demonstrated by a java.lang.OutOfMemoryError case. Tools like fastThread can assist in identifying problematic threads efficiently.

Threads that throw exceptions, like java.lang.OutOfMemoryError, should be examined for the source of issues. In this case, insufficient memory allocated for processing large XML payloads led to the error. Increasing the memory allocation resolved the problem, highlighting the importance of investigating exceptions in thread dumps for troubleshooting application issues.

we troubleshooted a CPU spike problem that surfaced in a major trading application in North America. All of a sudden, this application’s CPU started to spike up to 100%

The article discusses merging thread dump and top -H output to analyze CPU spike issues in applications. It outlines steps for capturing these data types, using the FastThread tool for analysis, and highlights the benefits through a case study from a trading application. Automation via REST API is also mentioned for efficiency.

This post discusses an issue experienced while analyzing a heap dump in Eclipse MAT, which crashed due to a missing font. The error, ArrayIndexOutOfBoundsException, was traced to font configuration in Linux. Solutions include installing the missing font, upgrading the JDK, or editing the OS font configuration to set Utopia as default.

A popular SaaS application encountering intermittent slowdowns was analyzed, revealing that a specific thread blocked 134 application threads due to an issue with the Log4j framework. This known bug necessitated an upgrade to Log4j2 to resolve the problem, emphasizing the importance of migrating from unsupported software for improved performance and stability.

The Round Robin load balancing algorithm often fails to evenly distribute traffic, especially when nodes are added. While it sends requests in a sequential order, existing nodes bear the brunt of user load, resulting in unequal processing. Alternatives like the 'Least Connections' algorithm can improve traffic distribution among nodes.

To troubleshoot OutOfMemoryError, follow three steps: capture heap dump using JVM arguments to automate collection when errors occur, restart the application to maintain stability, and diagnose the problem using tools like Eclipse MAT or HeapHero for automated analysis. This approach can streamline the troubleshooting process significantly.