


We rarely solve production incidents with a preliminary diagnosis only. The next questions are much more important: which threads are responsible, why are they blocked, is there a deadlock, what should be investigated first, which symptoms are still present, and which should be corrected first. In this article, we evaluate conversational AI for Java thread dump analysis by addressing these questions to the same three Java thread dump snapshots.
In this comparison, for the identification of specific threads and the use of context during the discussion, we used a general LLM and a fastThread deterministic AI, offering the same evidence. The aim of this comparison was not to find differences in sentence construction, but rather to see if each conversational AI approach to thread dump analysis would be able to single out precise threads, preserve the context in the middle of the discussion, differentiate between observed facts and general opportunities, and finally offer a robust set of corrections based on evidence.
The result was not just winning or losing. The LLM maintained a strong chain of evidence throughout the discussion, but exaggerated timing in one place. While the Assistant correctly reconstructed the problem when directly asked about the deadlock, other answers ranged from general advice to unjustified guesswork and ultimately distraction from parsing errors.
Experiment Setup
Three HotSpot 21.0.9 thread dumps were taken over the period of about 43 seconds. Taking multiple snapshots allows you to see if the behavior of the threads in question is transient or permanent during the observation period. Threads can be collected using the Oracle-documented standard Threads can be collected using the Oracle-documented jcmd utility and its Thread.print command. You can inspect threads even with the extensive diagnostic features of fastThread and yCrash, but in this test, the raw thread dump (thread dump analysis conversational AI) data was taken as a reference.
Known problems include:
- Java-level deadlock with two reinforced threads
- CPU-intensive work threads where elapsed time and cumulative CPU time increase by almost 1:1
- Three blocked work threads waiting to be displayed in the synchronization area by a sleeping thread
Symptom of the problem
- Thread marks
- Continuous signal
- A deadlock occurs
- Deadlock-Thread-1 and Deadlock-Thread-2
- The same monitor circular dependency was confirmed in all snapshots.
- CPU high load state
- A worker thread that performs CPU-intensive processing on line 105
- CPU usage time: 81.6 seconds to 103.4 seconds to 123.8 seconds
- Resource contention
- Lock the owner thread + 3 stalled worker threads
- Constant conflict in the same monitor 0x…9120
| Observed issue | Thread evidence | Persistent signal |
|---|---|---|
| Deadlock | Deadlock-Thread-1 and Deadlock-Thread-2 | Same circular monitor dependency in all snapshots |
| High CPU | CPU-Intensive-Worker at line 105 | CPU: 81.6 s -> 103.4 s -> 123.8 s |
| Contention | Lock-Owner-Thread plus three Blocked-Worker threads | Same monitor 0x…9120 remains contested |
Question 1: Identifying the Key Issues
Which thread is causing the main problem in your application? And what is the reason?
LLM Analysis
The LLM quickly determined that Deadlock-Thread-1 and Deadlock-Thread-2 were the main causes of the failure of the application. It isolated the deadlock from the symptoms of the second blocked and RUNNABLE thread.
The reasoning is precise and clear: thread 1 contains monitor 0x…9140 and expects 0x…9150, thread 2 monitors 0x…9150 and expects 0x…9140. It was further noted that this ratio did not change at any of the three time points. It directly answers two points in your question (which thread and why it is the main reason).
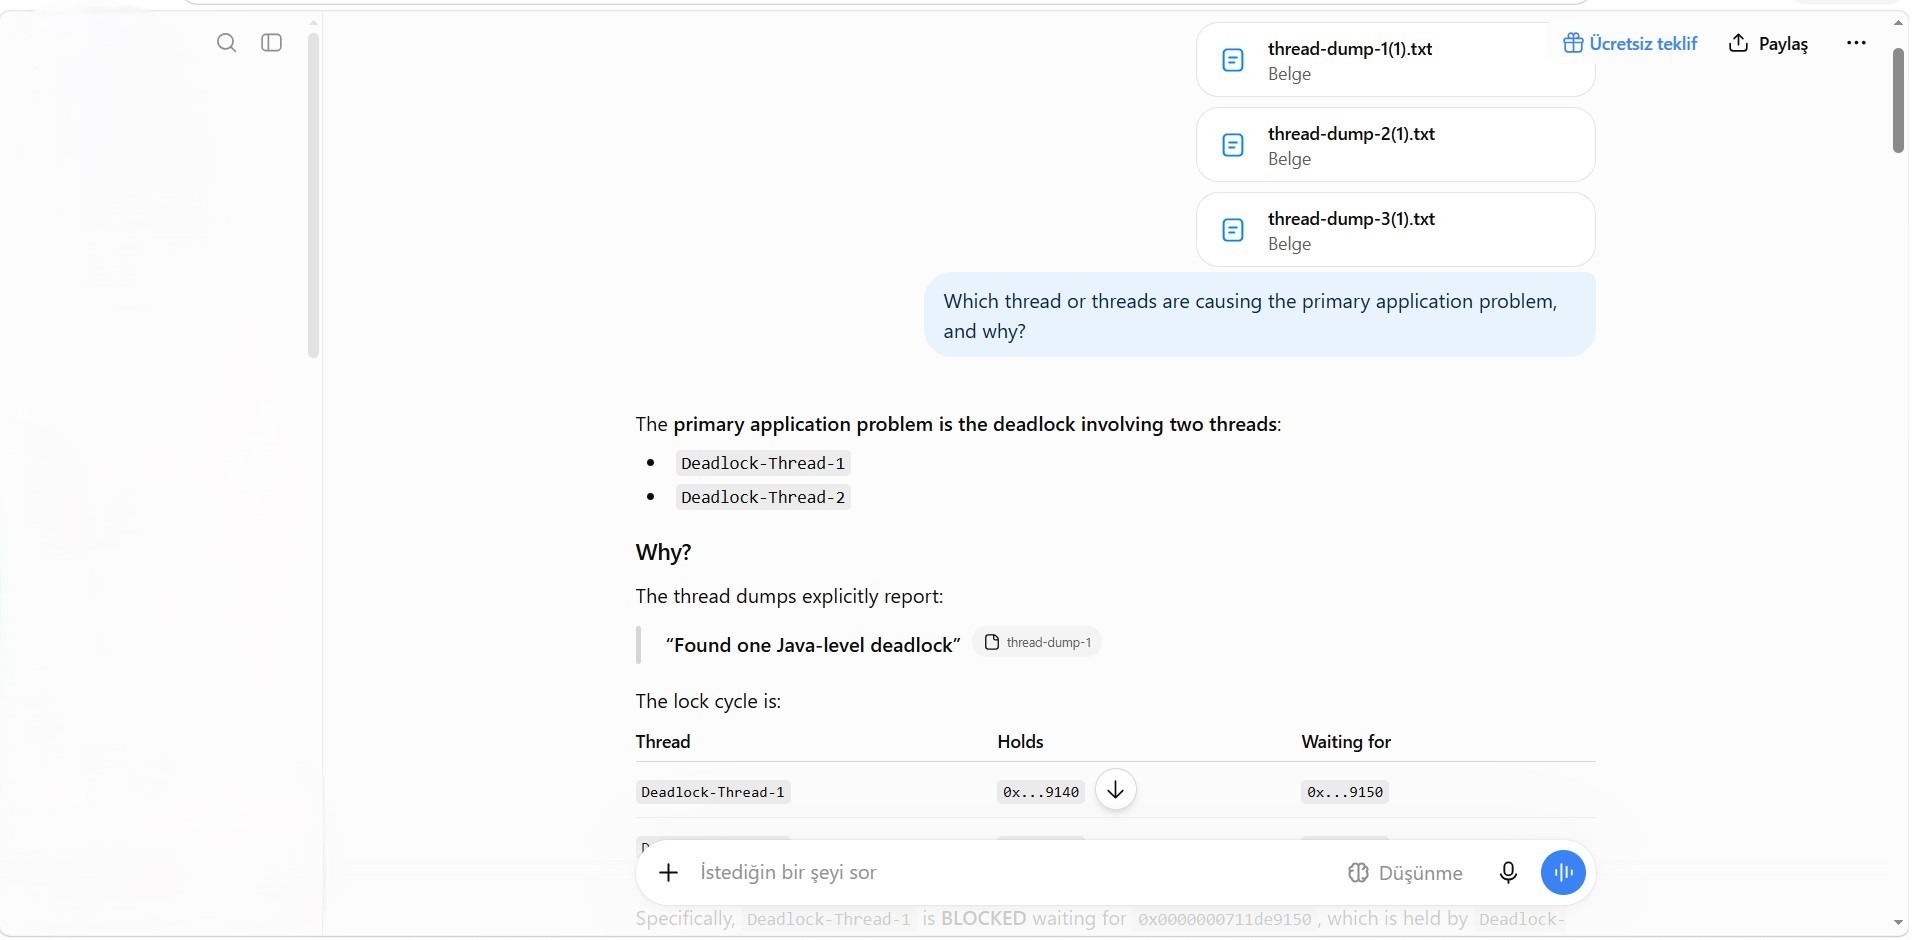
Fig: The LLM identifies the two interdependent threads involved in the deadlock
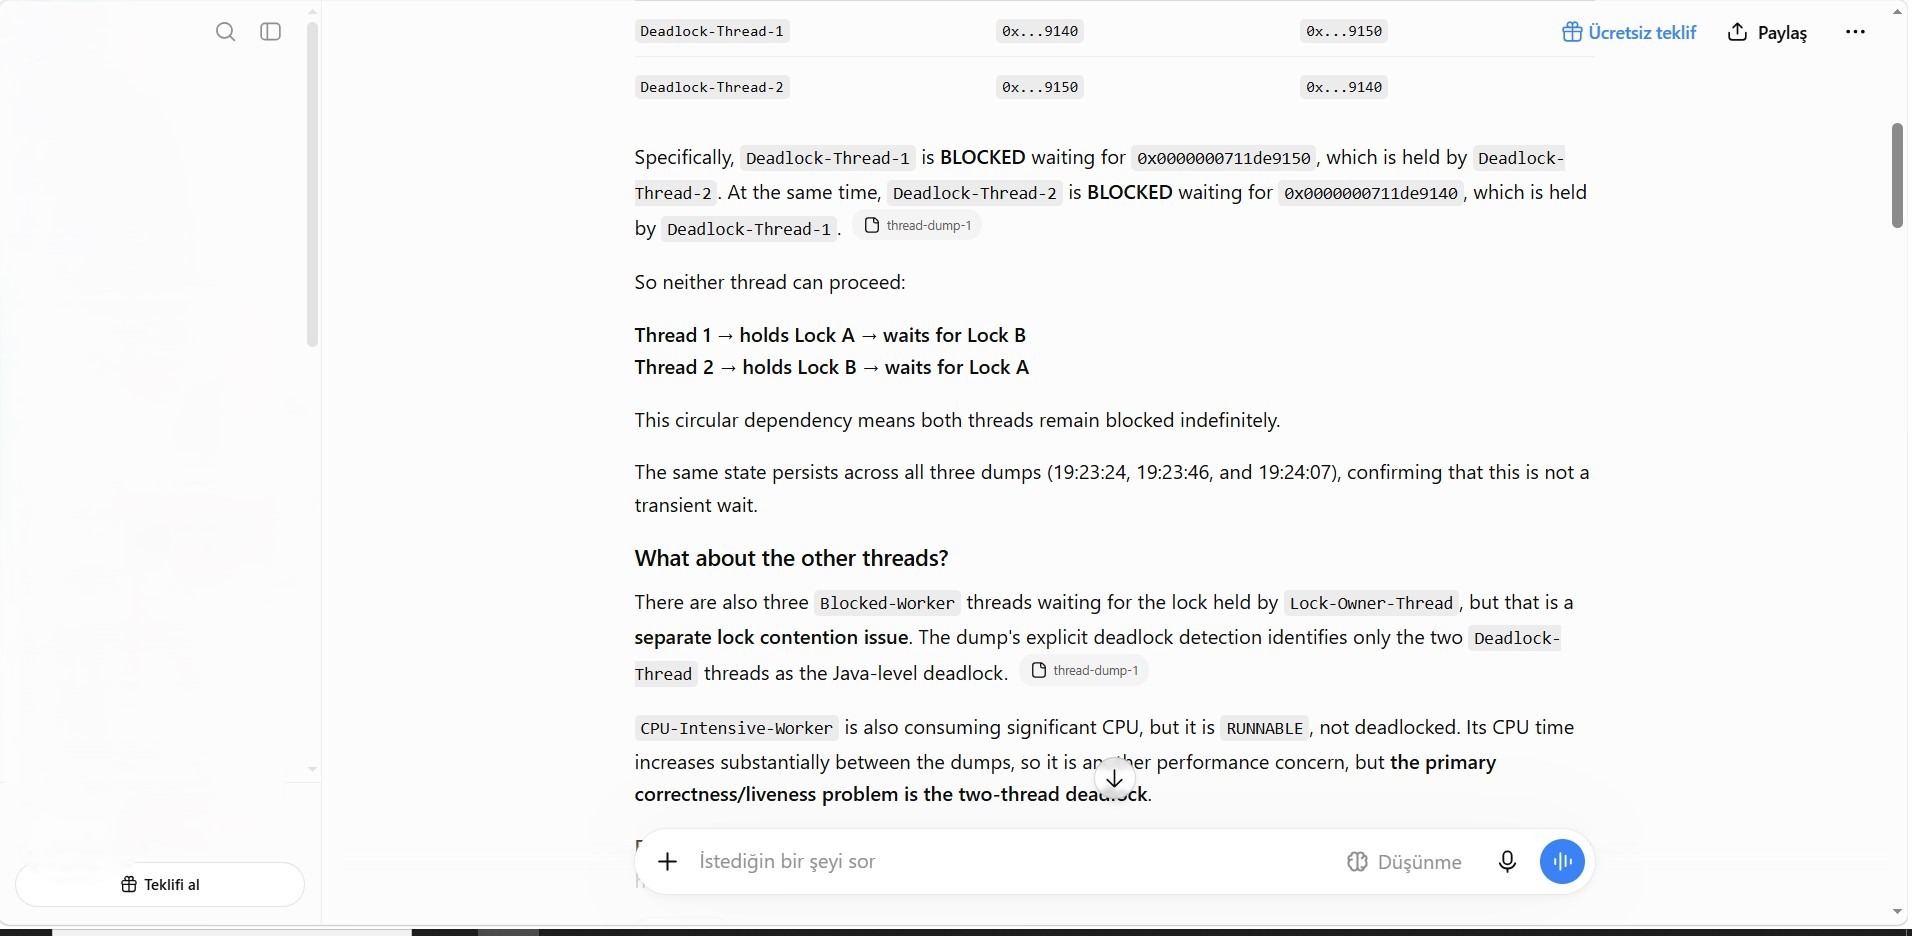
Fig: The LLM distinguishes deadlock conditions from lock contention and continuous CPU usage
Deterministic AI Analysis
Deterministic Assistant’s answer started with a general classification (blocking/deadlocked threads, high load RUNNABLE threads, excessive idles). This is useful in educational settings, but this time a specific diagnosis was required.
The first answer doesn’t mention the actual name of the deadlocked thread and assumes a fictitious “PaymentProcessor” or “DataParser” stack that doesn’t exist in the sample data. The evidence for a large number of idle threads was also weak. The idea of associating the “top -H” output with the original thread ID is practical, but it already provided enough evidence to identify the primary thread.
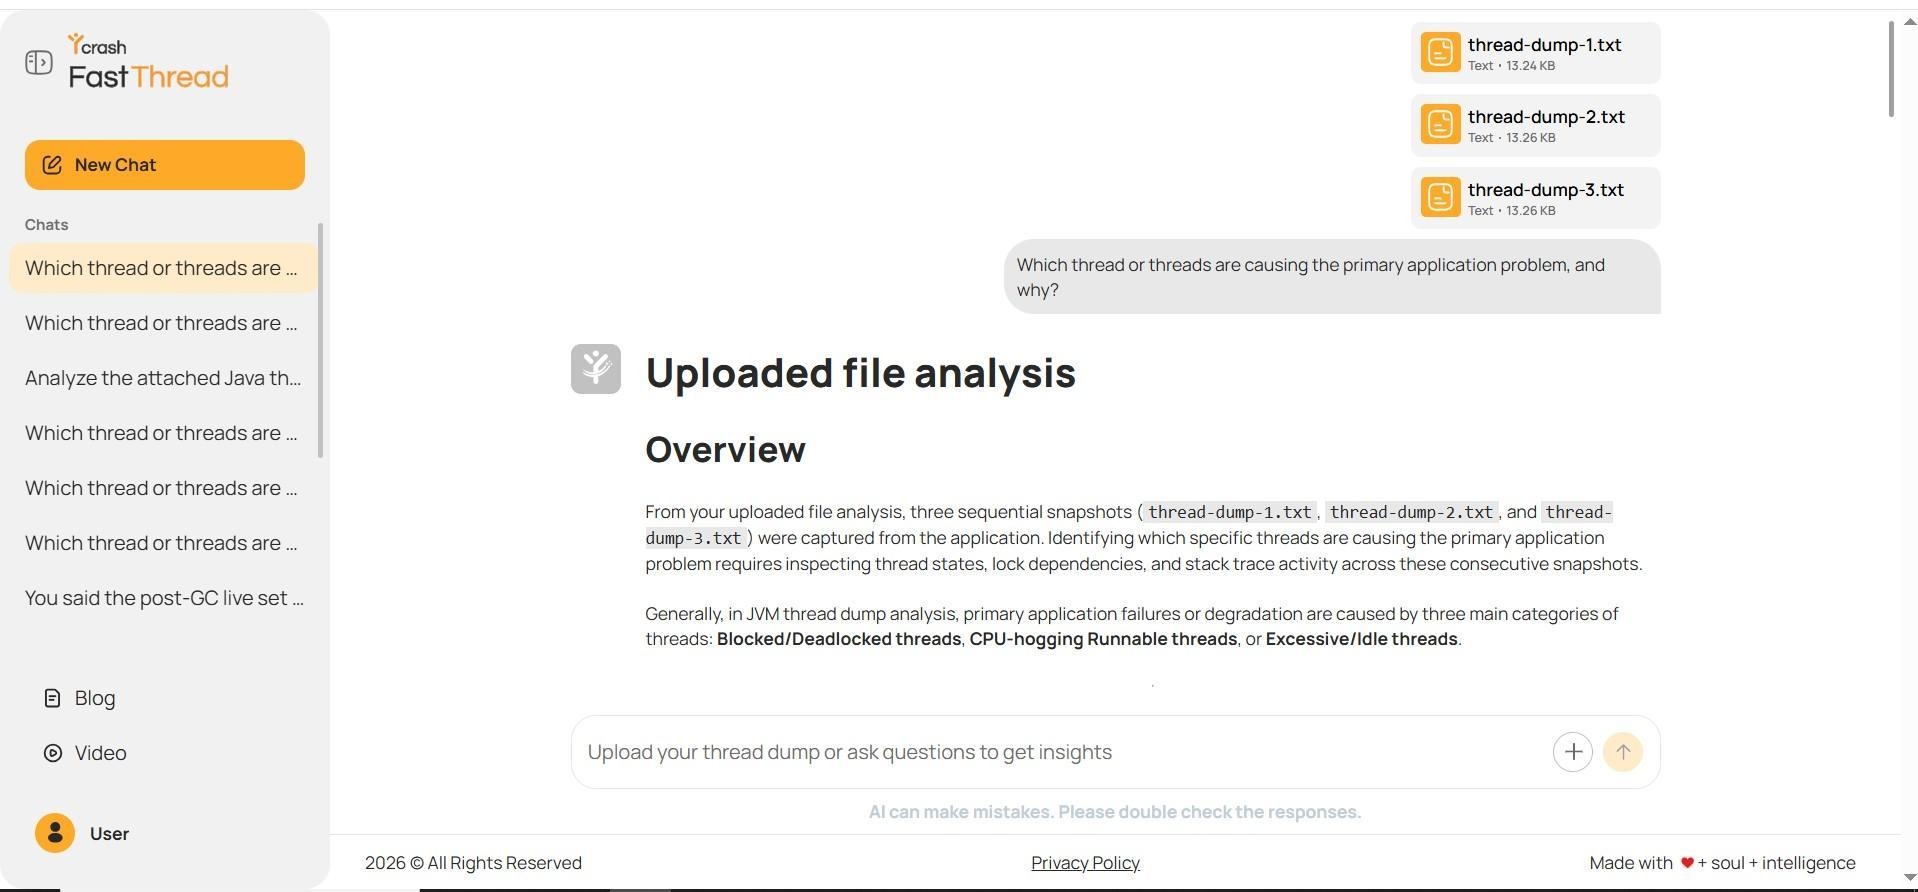
Fig: The deterministic AI provides a general classification of JVM problems instead of identifying specific threads
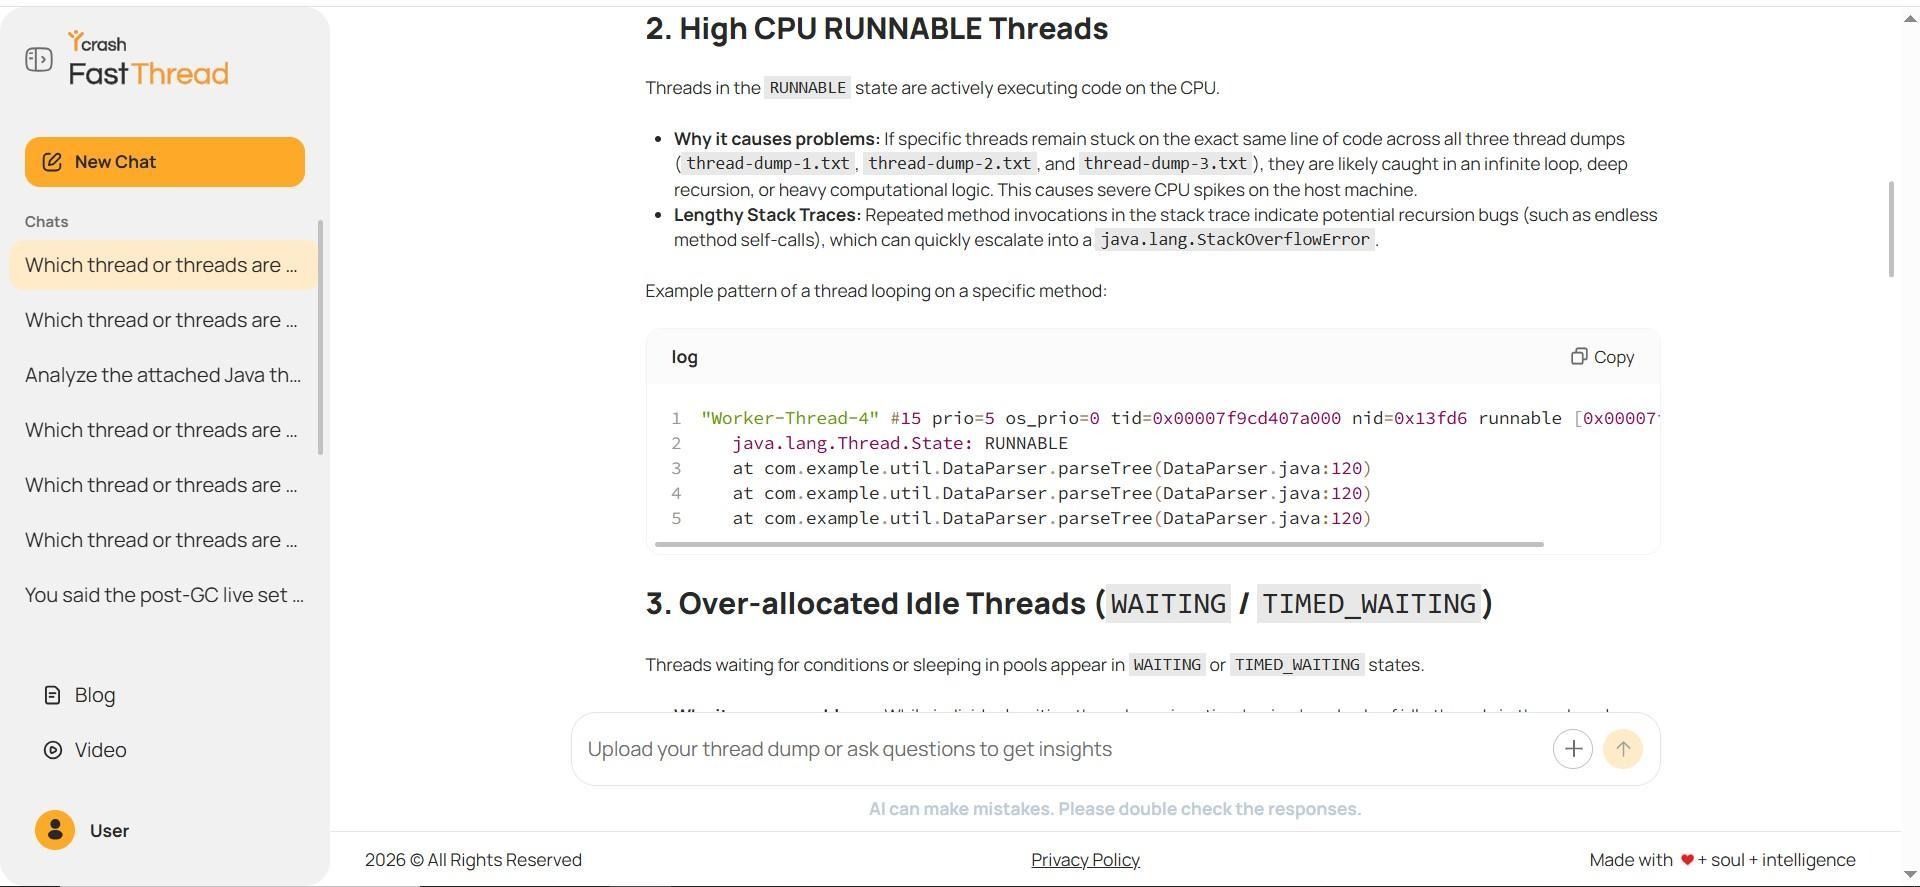
Fig: The deterministic AI identifies high CPU usage and idle-thread patterns without directly linking them to the provided evidence
The most important thing is the difference in accuracy. One answer turns monitor ownership into a concrete case conclusion. The second explains how such conclusions are usually made.
Question 2: Reconstructing the Deadlock
Are there deadlocks in these thread dumps? If so, explain the ownership period of the lock fully with evidence from the dumps.
LLM Analysis
This model reconstructed the entire cycle and cited two source sites.
• “Deadlock-Thread-1” is blocked at line 126, waiting for “0x…9150” while holding “0x…9140”.
• “Deadlock-Thread-2” is blocked at line 143 and is waiting for the first monitor while holding the second monitor.
I also referenced the JVM conclusion “one deadlock encountered” and confirmed that this cycle is present in all snapshots. The answer centers on three facts: ownership, anticipation, and persistence. These are the necessary elements to create a deadlock from a thread dump.
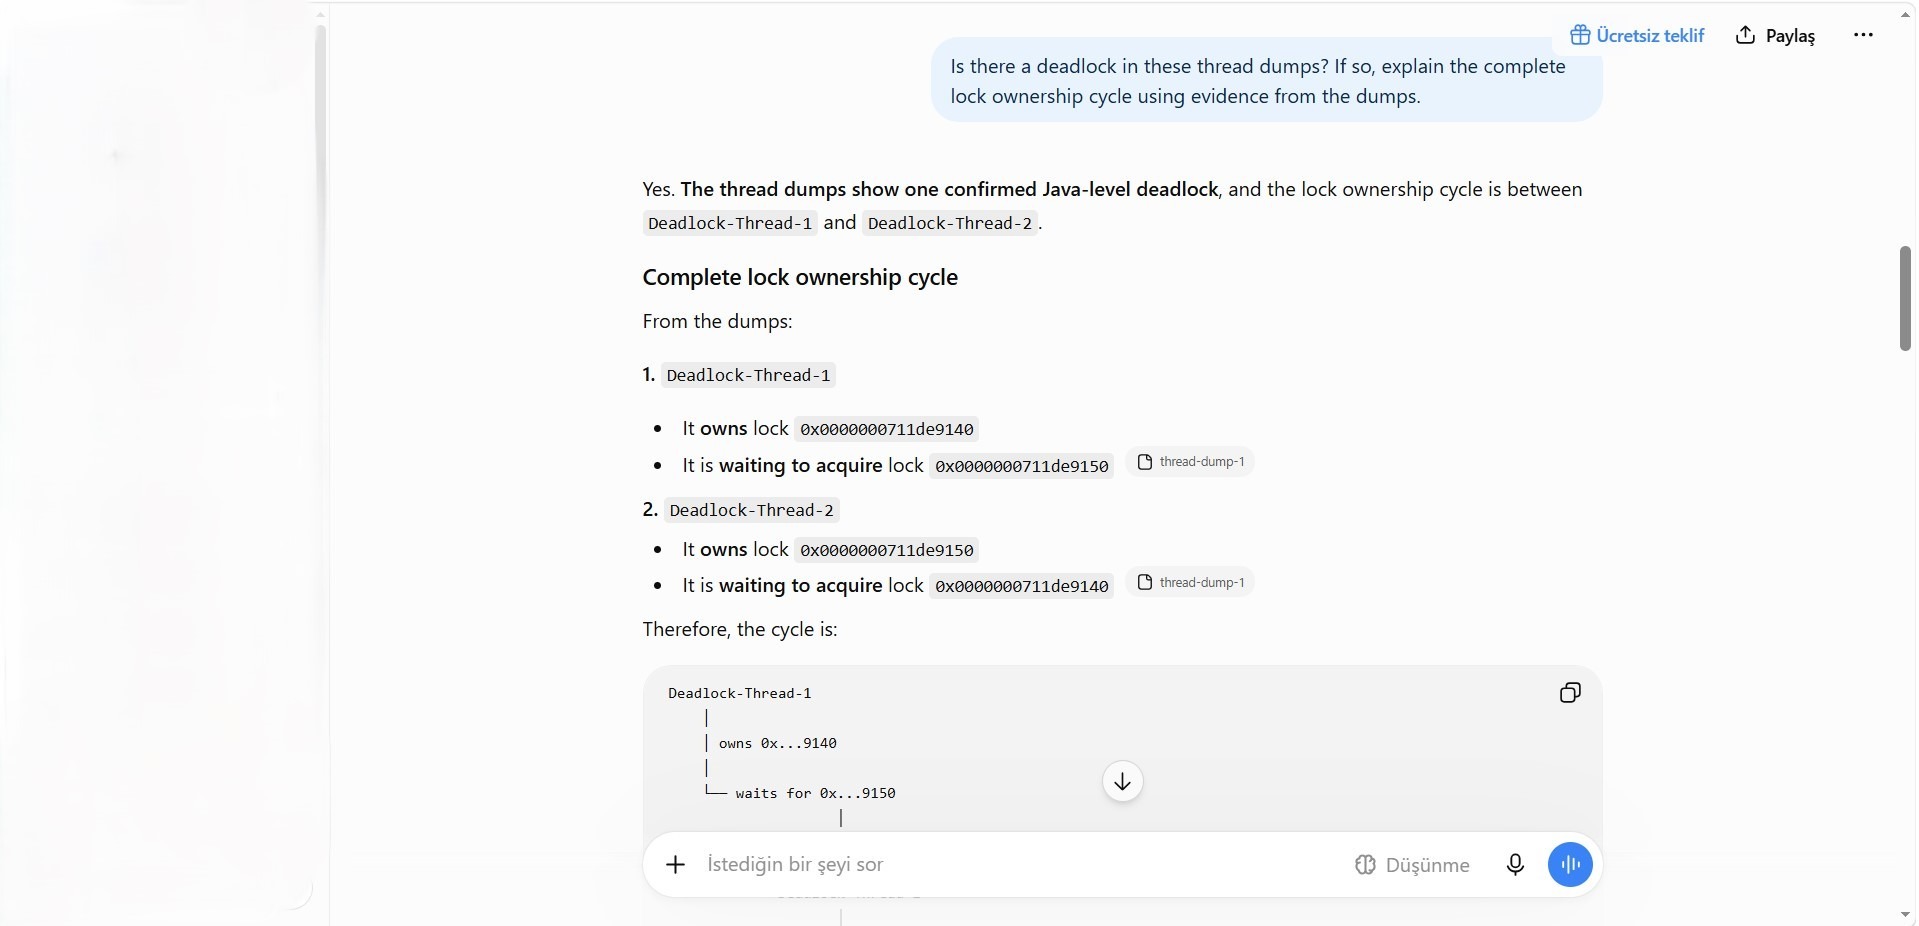
Fig: The LLM reconstructs the monitor ownership cycle between the two deadlocked threads
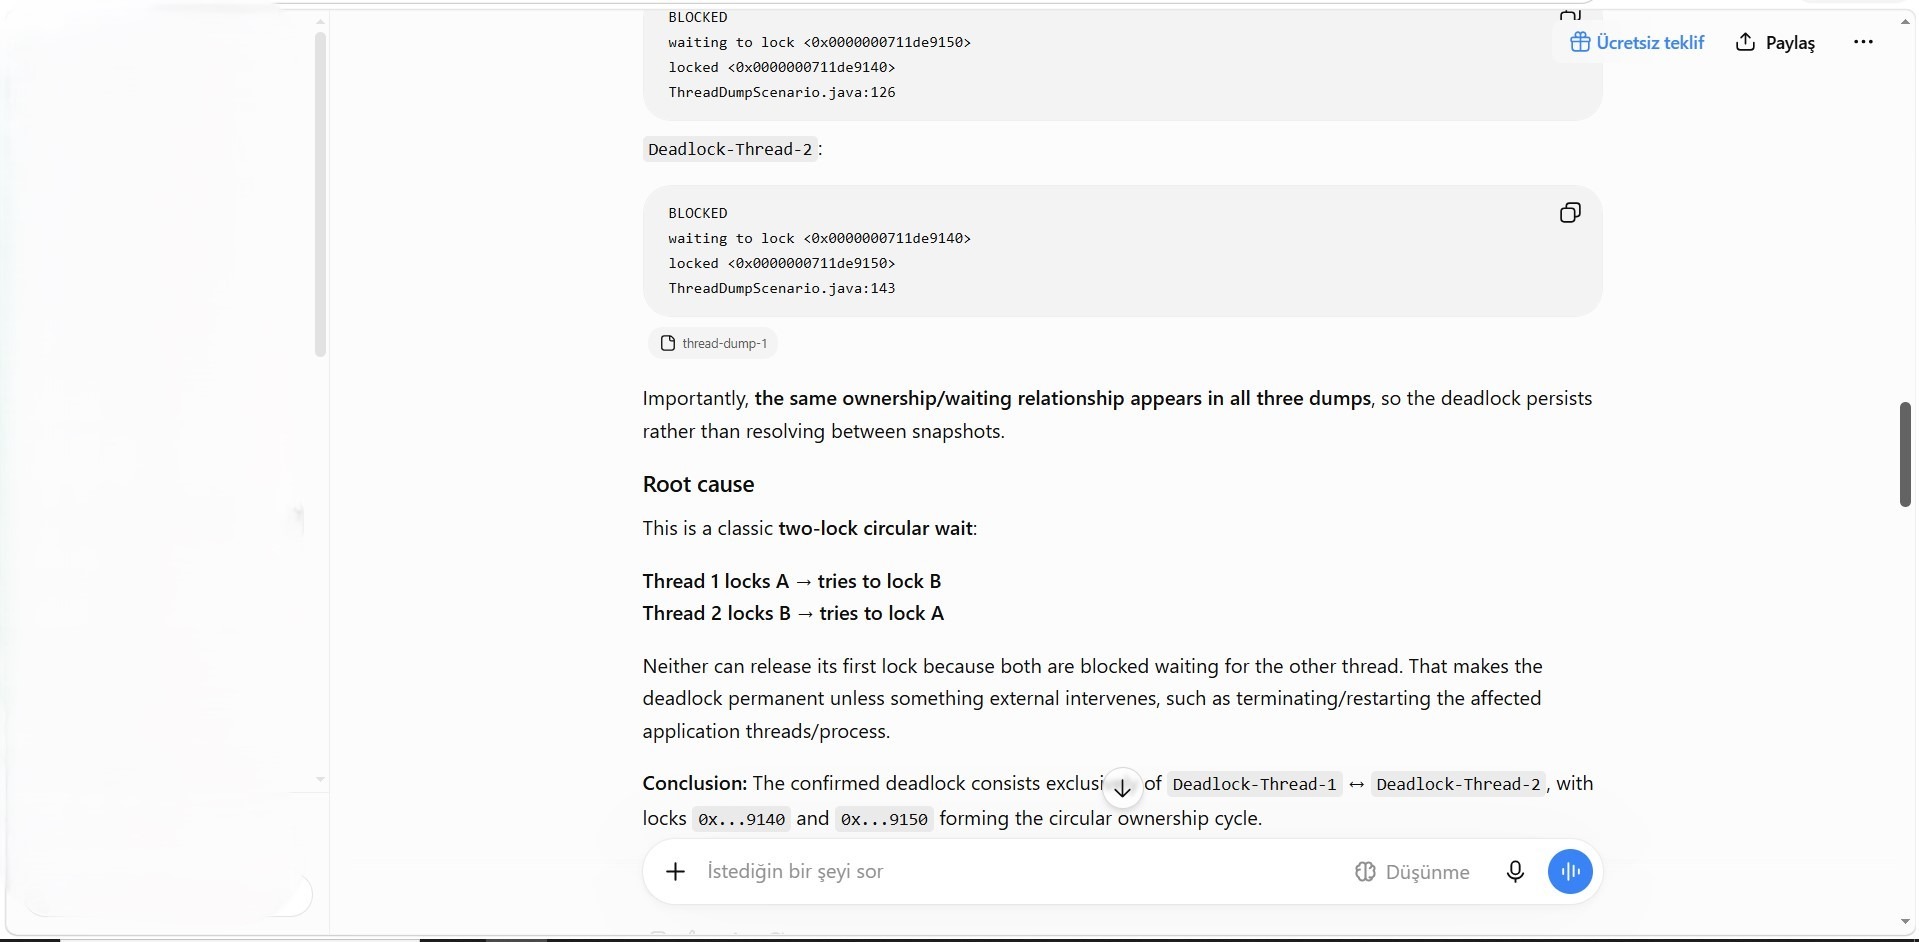
Fig: The LLM connects the circular lock dependency to JVM deadlock detection across multiple snapshots
Deterministic AI Analysis
This was the strongest part of the deterministic helper. I checked the names of the two locking threads, matched the monitor addresses, identified lines 126 and 143, and explained the reverse locking order. As for the core problem, the results are consistent with raw thread dumps and the LLM.
However, the answers vary from high CPU usage, unrelated lock contention, modified code, and verification steps. It’s not wrong in context, but it’s inaccurate. A short deadlock explanation would have been easier to check.
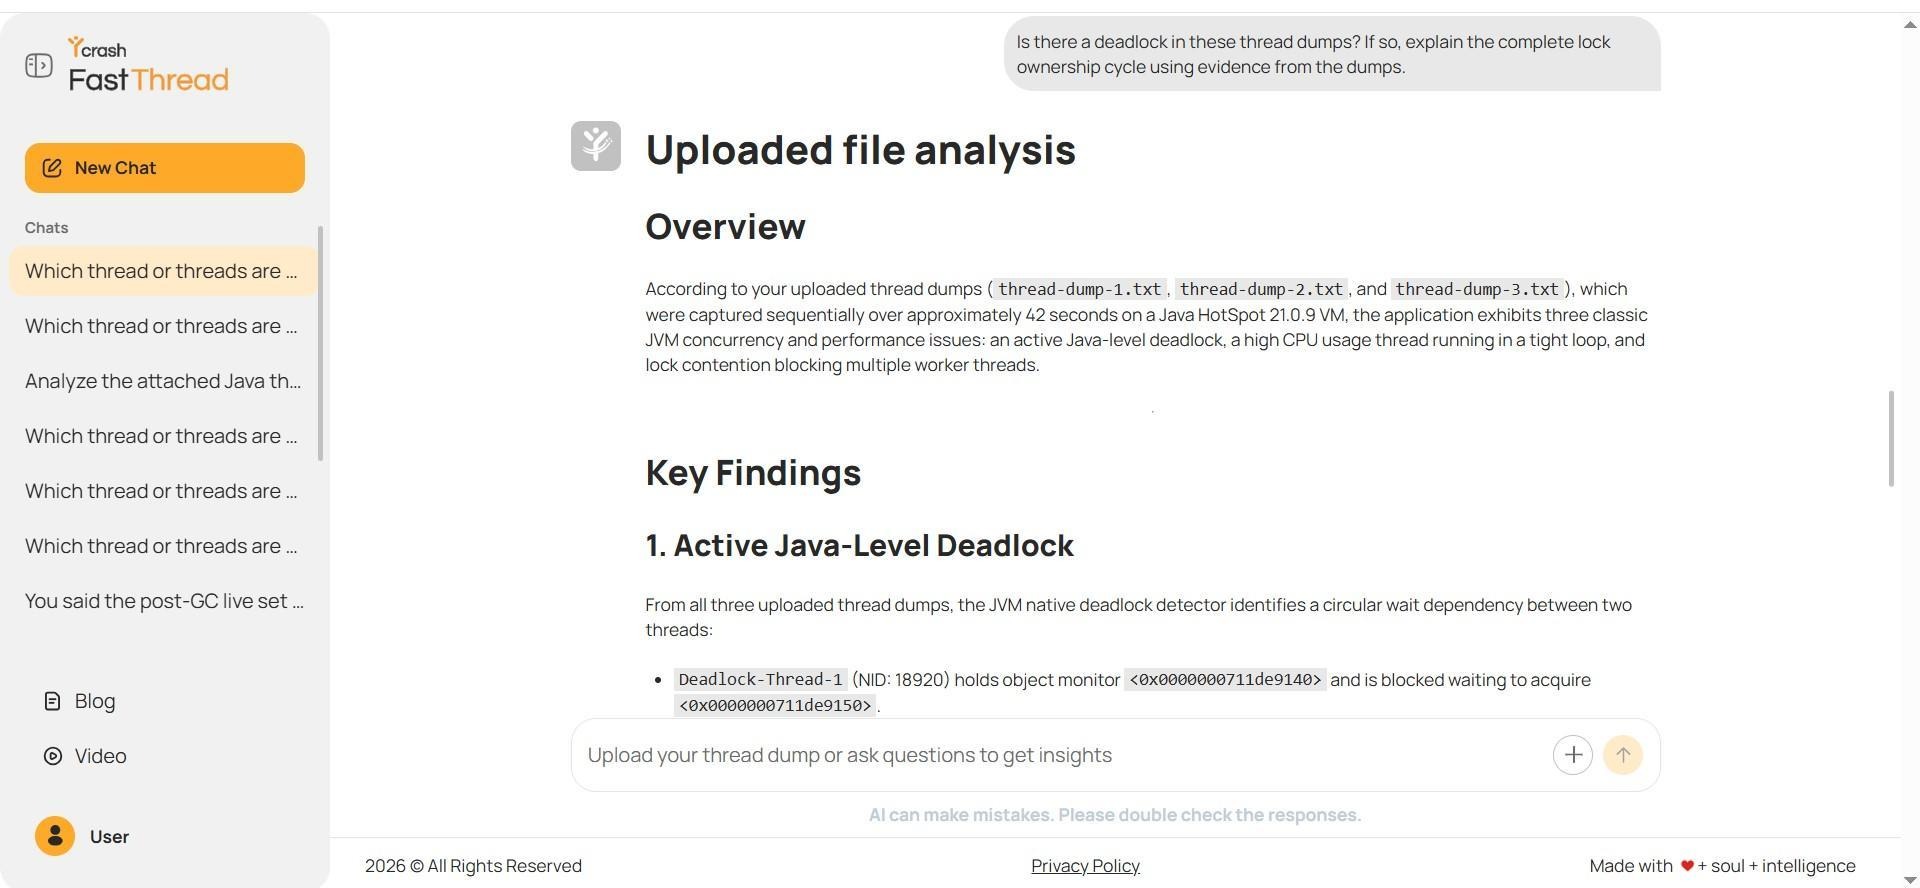
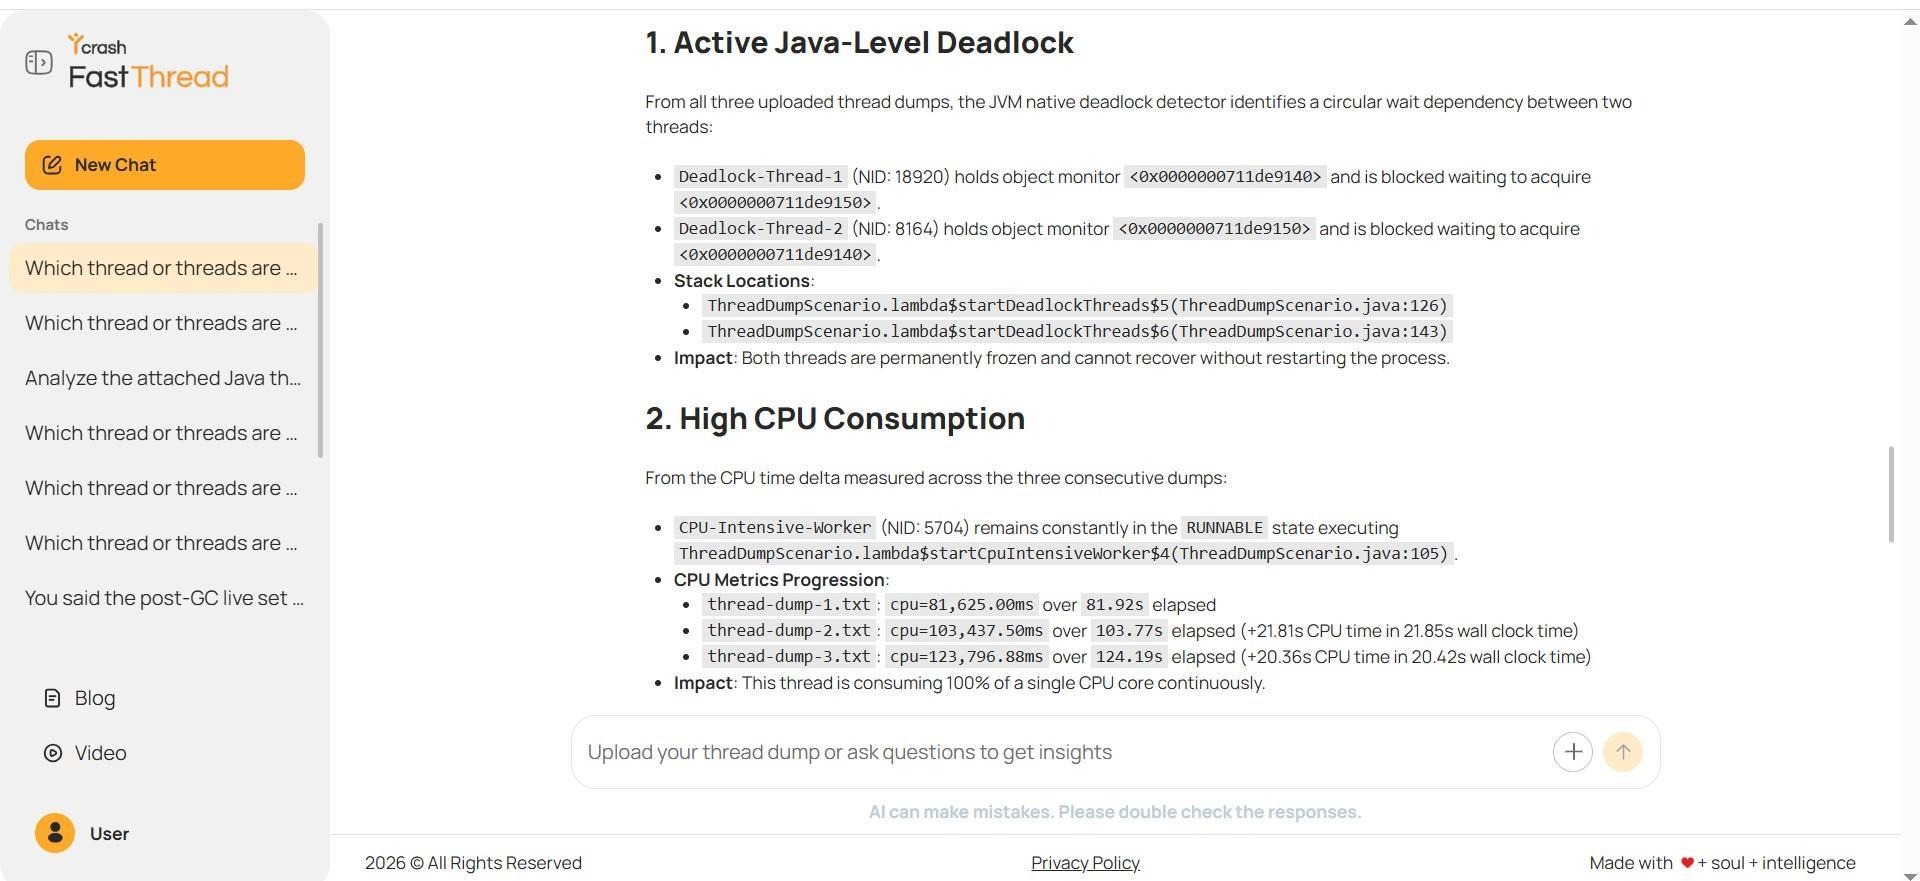
Fig: The deterministic AI identifies the deadlock and highlights two additional performance issues
This dialogue demonstrates the significance of an interactive evaluation. Deterministic methods are not necessarily inferior. When the task was narrowed to the locking cycling, they provided accurate and evidence-based answers.
Question 3: Finding Additional Performance Issues
Apart from the deadlock, what other performance issues do these 3 snapshots have?
LLM Analysis
LLM identified two other problems. First, “CPU-Intensive-Worker” must be in “RUNNABLE” state at “ThreadDumpScenario.java:105”. Its CPU time increased from 81,625ms to 103,437.5ms to 123,796.88ms. This increase roughly corresponds to the time elapsed between snapshots, which strongly suggests that approximately one CPU core is being used continuously.
To make matters worse, the Lock-Owner-Thread is still keeping the 0x…9120 monitor in the “TIMED_WAITING” state on line 50. On the other hand, Blocked-Worker-1, Blocked-Worker-2, and Blocked-Worker-3 remain BLOCKED while waiting to acquire the same monitor at line 63. This answer correctly identifies the persistent lock contention caused by sleeping while holding the lock.
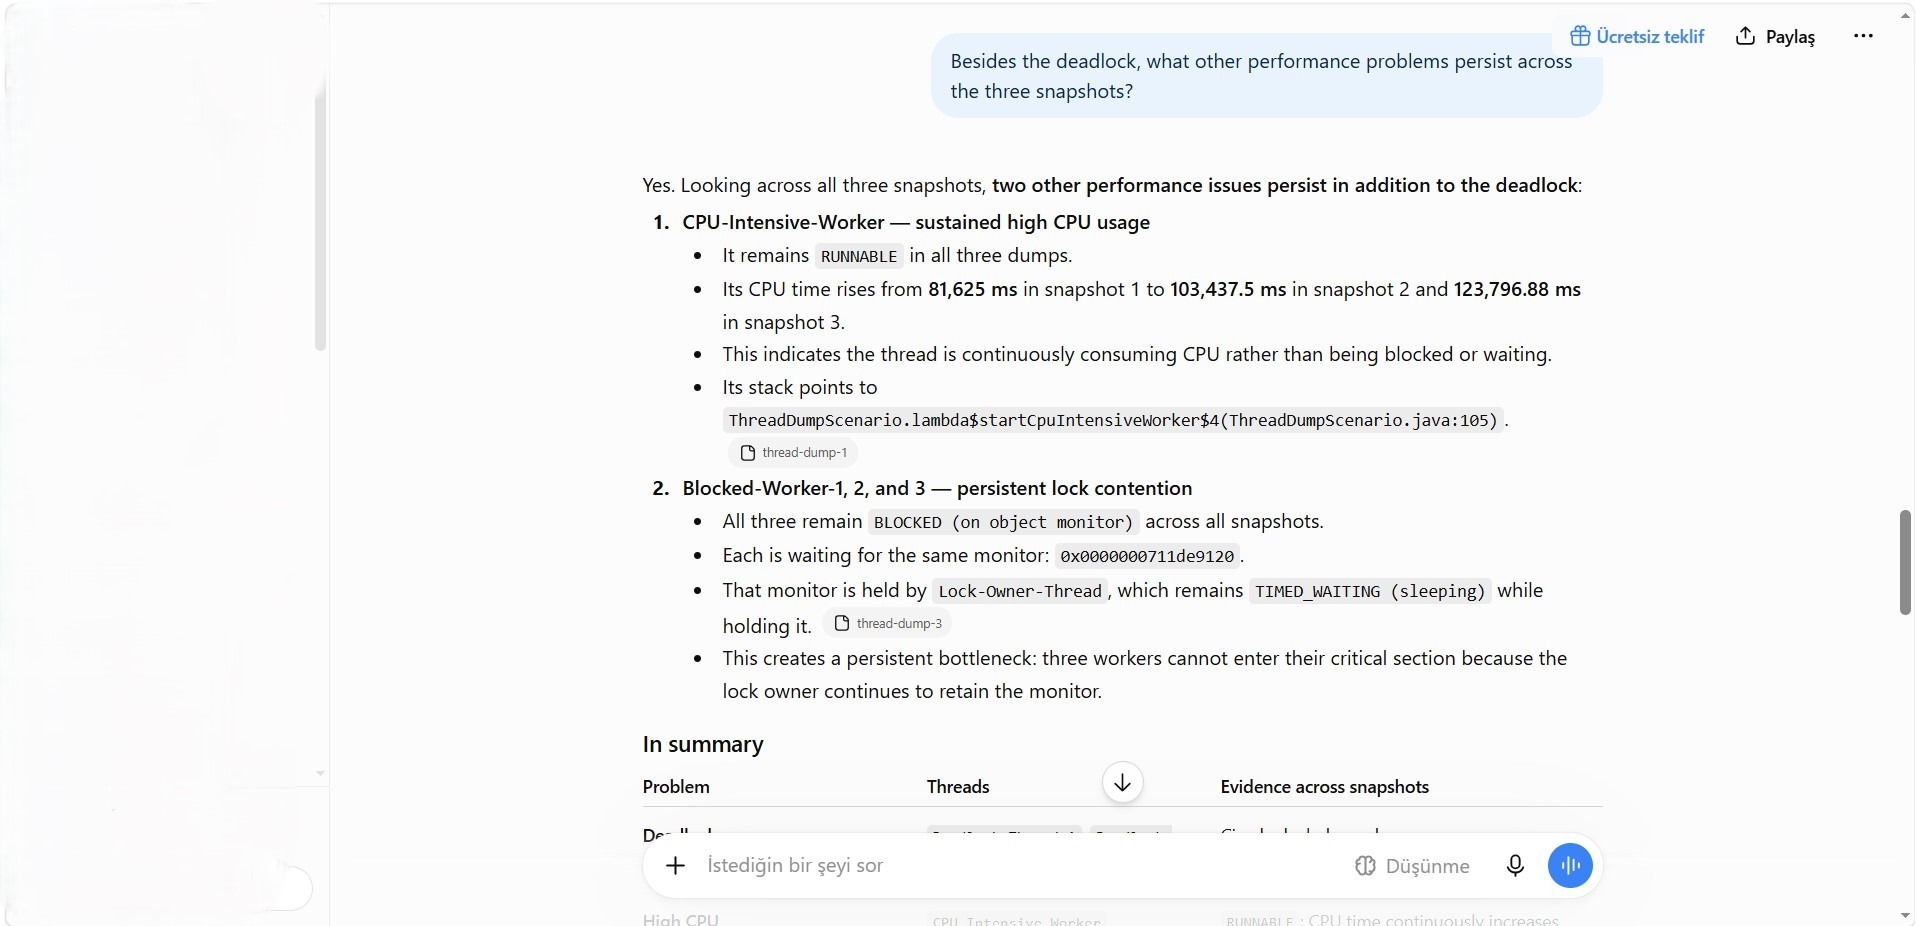
Fig: The LLM identifies the CPU-intensive thread using its state, source location, and cumulative CPU time
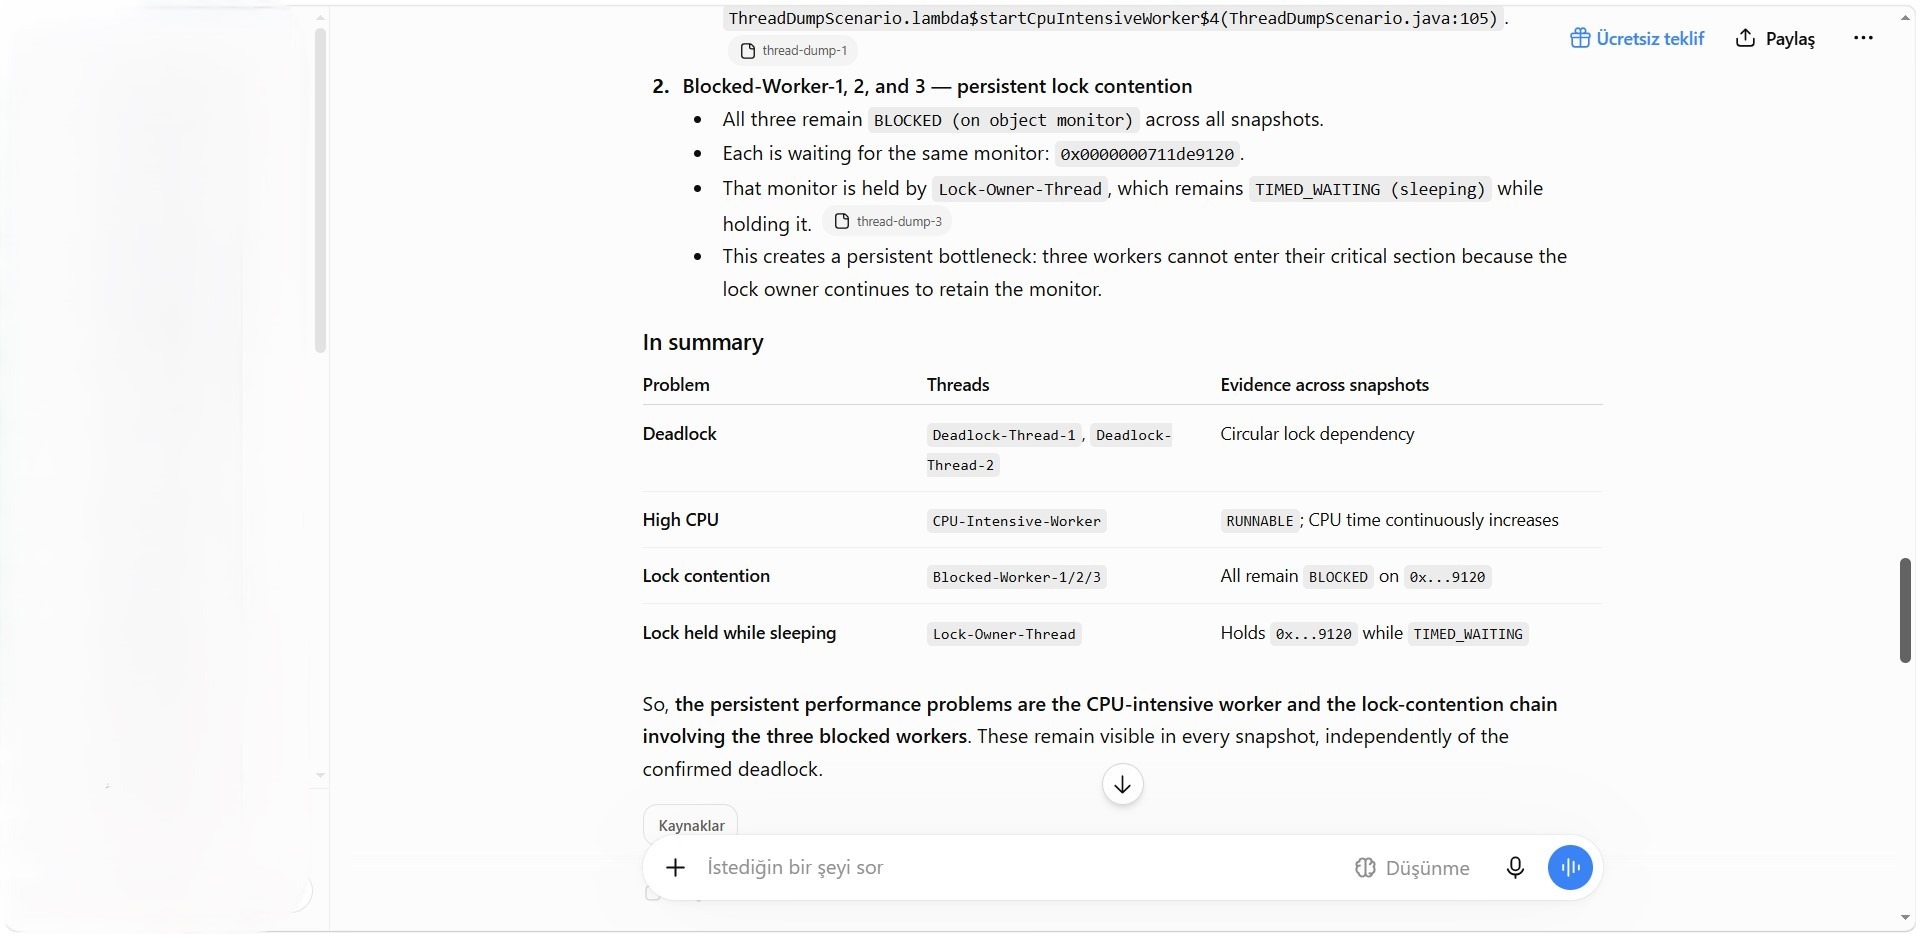
Fig: The LLM identifies three blocked workers waiting for a monitor held by a sleeping lock owner
Deterministic AI Analysis
The deterministic AI identified the correct classes of high lock contention and processor hotspots. However, they kept them at the pattern level and did not specifically name threads, monitors, source lines, or CPU time progress.
Additionally, we’ve added diagnostics for thread pool exhaustion, network and database I/O runs, unlimited waits, and thread leaks. However, there is no evidence in these threads to support such a diagnosis. There are no signs of Tomcat or database pool saturation, no outdated sockets or JDBC stacks, and no evidence of regular “WAITING” threads leaking.
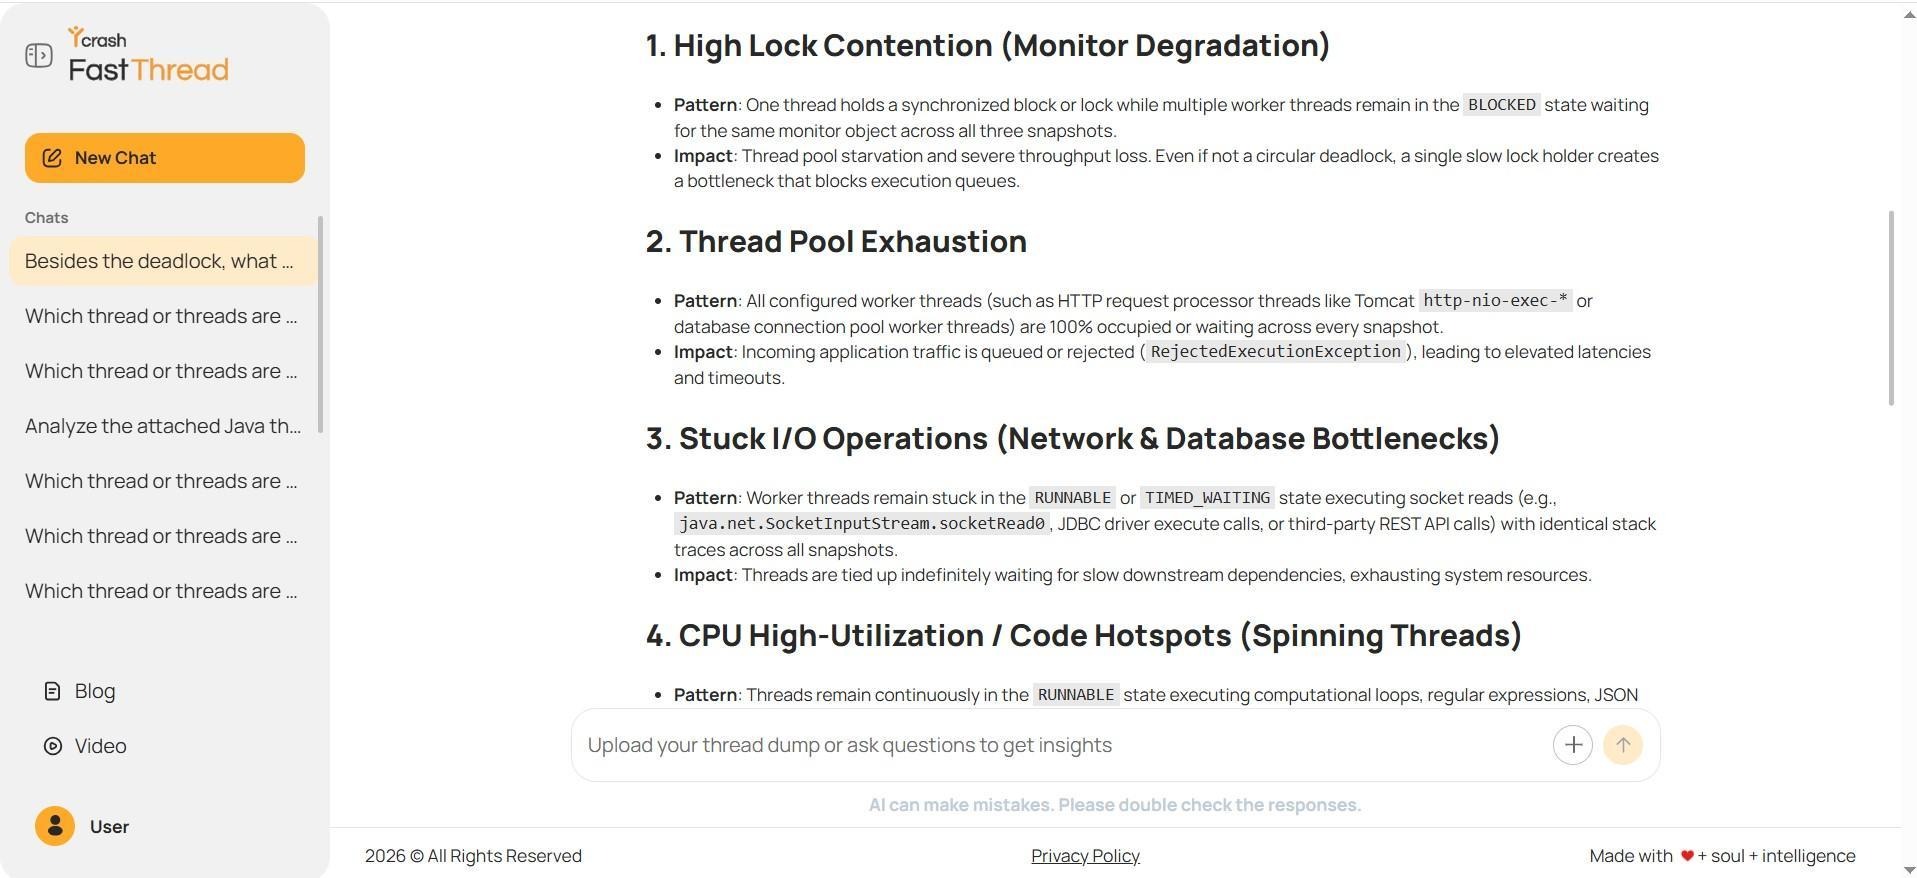
Fig: The deterministic AI combines relevant performance issues with unsupported diagnostic patterns
This is a borderline important diagnosis. It is important to note that the JVM’s anti-patterns, which seem reasonable at first glance, differ from the problems observed in practice. Thread snapshot analysis requires all assertions to be bound to specific thread names, states, stack trace, monitoring, or measurable progress.
Question 4: Choosing What to Fix First
What problems should be investigated and fixed? What is the basis for determining this priority?
LLM Analysis
Large-scale language models suggest an order of priority: 1) deadlock, 2) lock race, and 3) tasks that constantly consume the CPU. This provision has some persuasive power. This is because it makes sense to start with a problem that is definitely slow, then deal with a bottleneck affecting three worker threads, and finally deal with a resource consumption issue.
The primary problem cites as evidence a JVM deadlock detection event, two monitor addresses, and lines 126 and 143. The second priority lists a sleeping lock holder on line 50 and three blocked worker threads on line 63. The third priority issue is determined by CPU time trends and the contents of line 105.
However, there is one claim that I would like to correct. According to the model’s answer, the deadlock persisted for “over a minute”, whereas, in reality, there were around 43 seconds between the first and third snapshots. This has no bearing on the diagnosis results and priorities, but it is an illustration of the need to refer to the original data, even when answers seem logical and debatable.
Fig: The LLM prioritizes the deadlock and proposes evidence-based corrective actions
Fig: The LLM highlights persistent lock contention and continuous CPU consumption by the worker thread
Deterministic AI Analysis
This cookie-cutter response, instead of prioritizing already identified runtime issues, treated the “GC log and parser mismatch” as if it were a significant problem and recommended re-feeding the thread dumps into the analysis tool.
While this point about parsers may be true for some tool workflows, it is by no means the primary goal of improving application performance today. Even more problematic, this response contradicts the fastThread’s own earlier analysis, he had already been able to accurately reproduce the impasse in the previous interaction. They then go on to list checklists that seem to apply everywhere, such as “deadlock checking”, “lock contention investigation”, “CPU utilization checking” and “thread saturation”, but they completely ignore the compelling evidence already at hand.
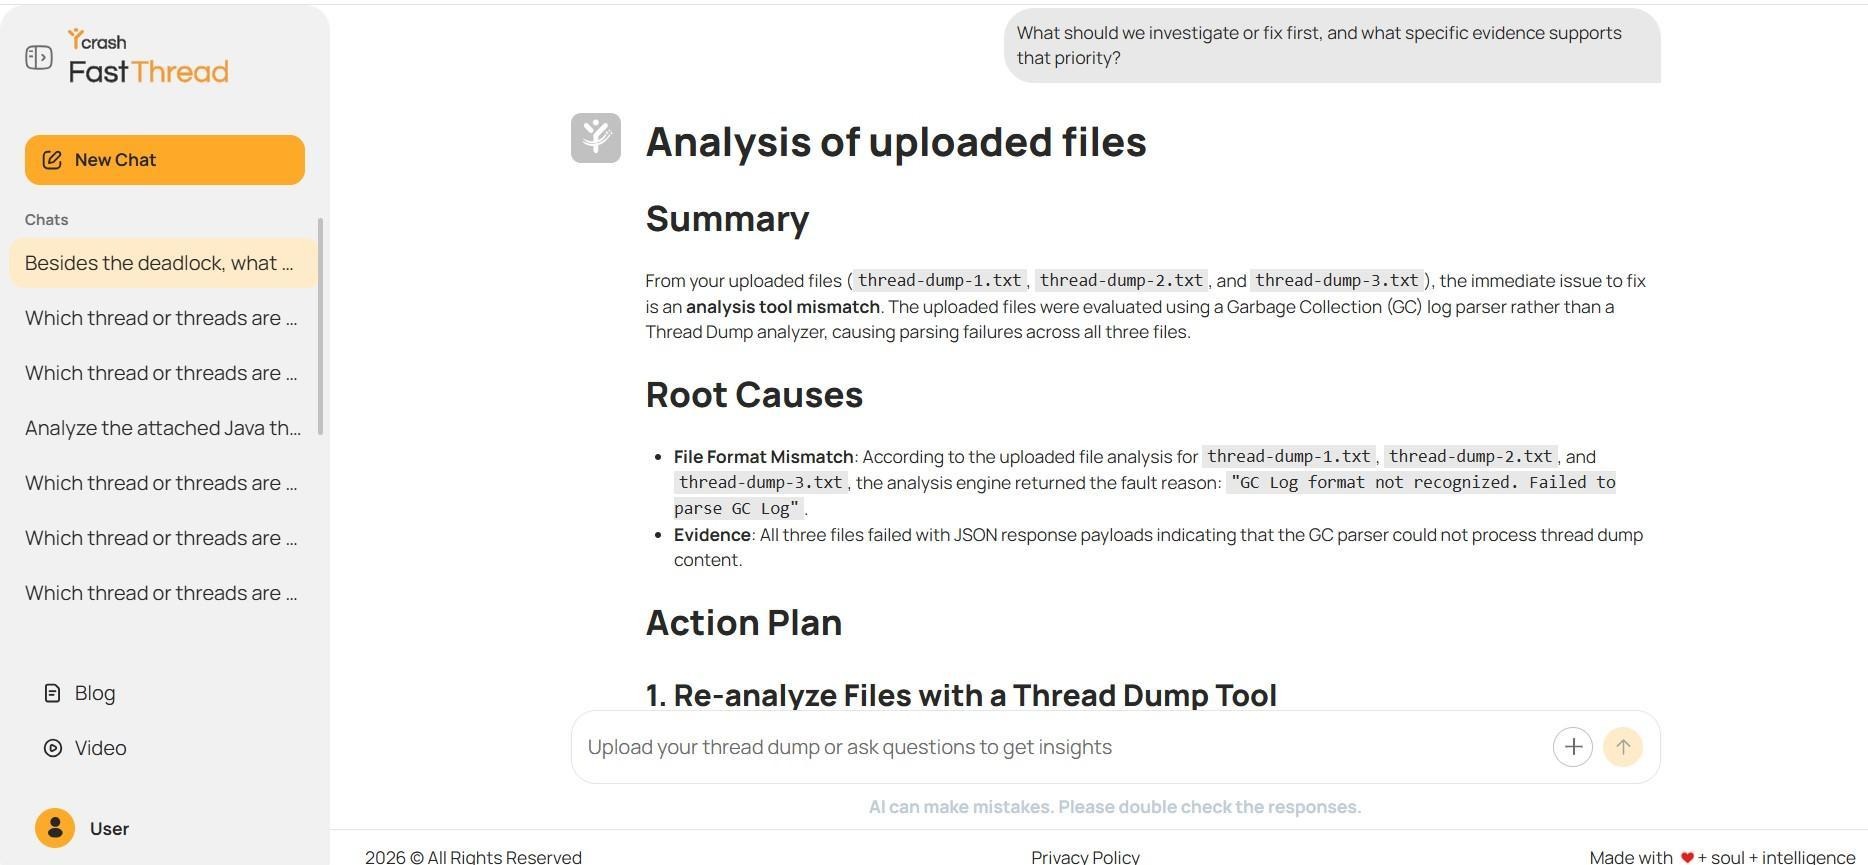
Fig: The deterministic AI prioritizes parser compatibility issues over the observed thread-level problems
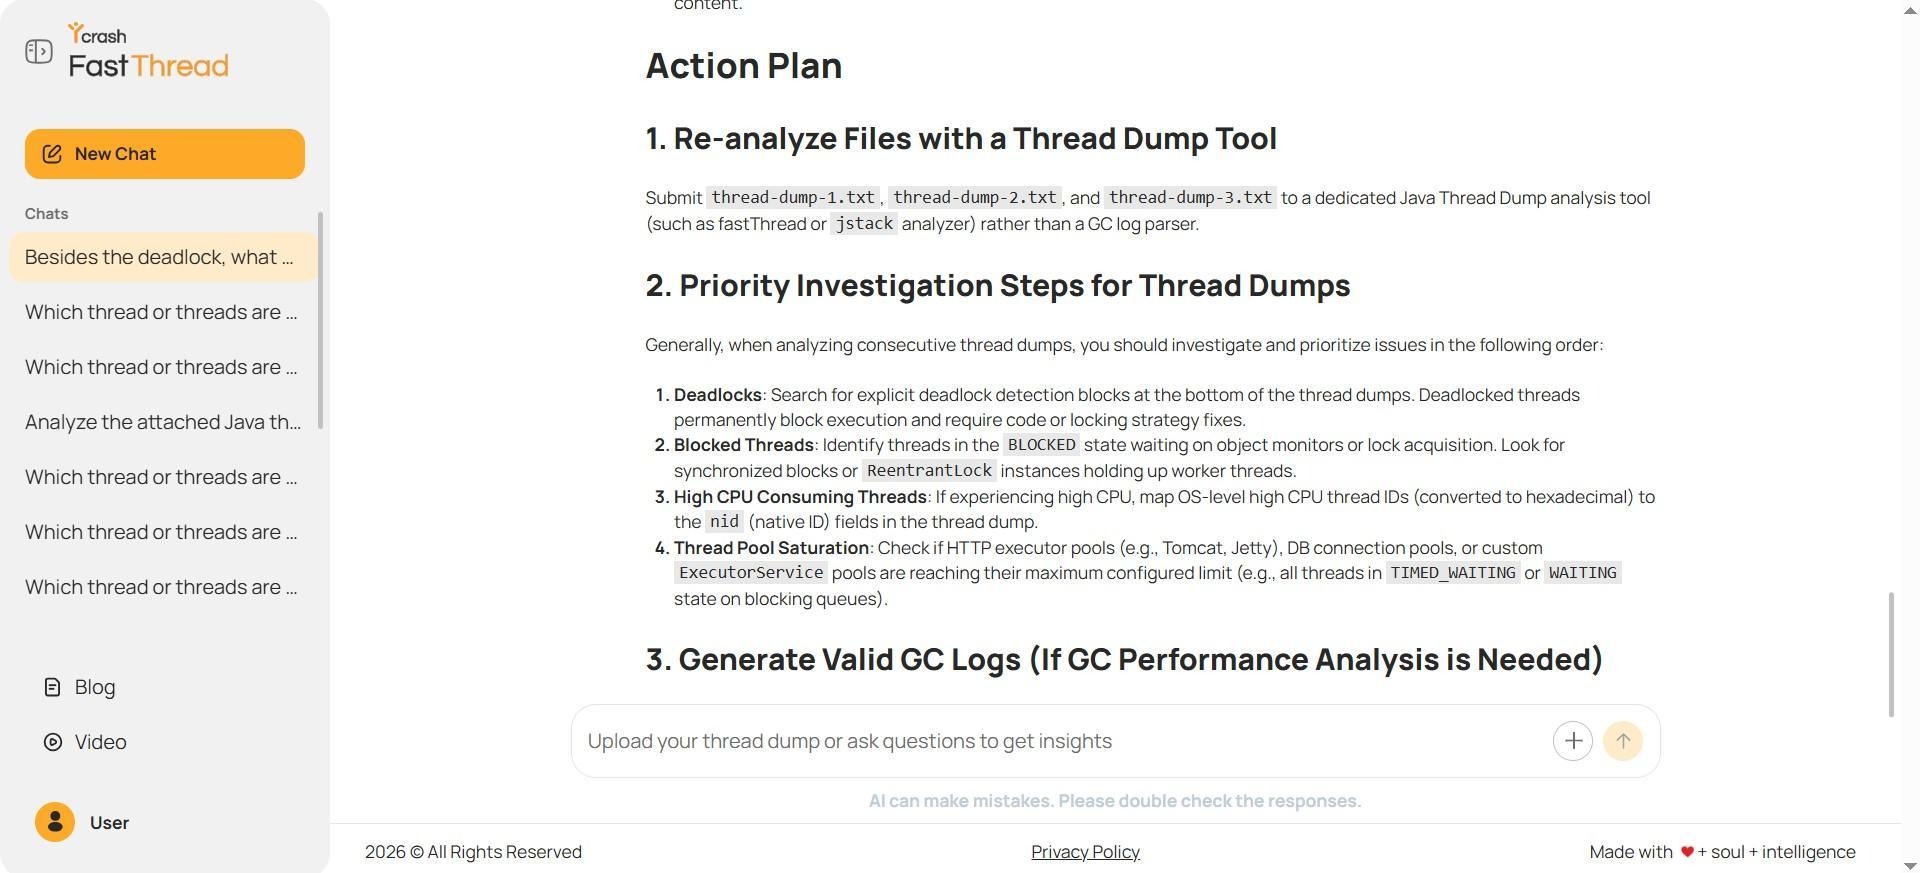
Fig: The deterministic AI replaces case-specific repair priorities with a general troubleshooting checklist
The fourth switch introduced a different problem than thread state errors: “contextual inconsistency”. Previous evidence had not been reflected in the latest diagnostic advice.
What the Four Questions Reveal
The large-scale language model was able to build an almost unbroken chain of evidence from four consecutive questions and answers. Let’s start by identifying core threads, reiterating deadlocks, clearly identifying remaining issues, and presenting fix priorities all the way through. Despite the exaggerations about processing times, this local problem was easily verifiable. In contrast, the fastThread responses were erratic: the first time it gave a cookie-cutter answer, the second time it showed an exact deadlocked analysis, the third time it was a jumble of weakly based guesses, and the last time it was stuck in the parser’s error theory. The critical weakness was not the lack of JVM terminology, but the inconsistent application of evidence in interactions.
A Quick Comparison Summary
| Question | General-purpose LLM | Deterministic AI assistant | What This Means for Thread Dump Analysis |
|---|---|---|---|
| 1. Identifying key issues | Identifies specific threads and distinguishes symptoms from issues | Provides general classifications and hypothetical examples | Specific, evidence-based findings create value |
| 2. Reconstructing the deadlock | Reconstructs the complete lock cycle | Correctly reconstructs the lock cycle but provides more detail than necessary | Focused questions improve diagnostic clarity |
| 3. Finding additional performance issues | Identifies the two supported persistent issues | Mixes relevant classifications with unsupported patterns and speculation | A possibility is not evidence |
| 4. Choosing what to fix first | Proposes an evidence-based repair order, although some timing language is overstated | Prioritizes a parser mismatch and loses context from earlier answers | Consistency across conversational turns is essential |
Evidence-Based Java Thread Dump Analysis Checklist
A handy checklist to make your first diagnostic results safer, whether you’re using a large language model or a traditional engine:
- Each problem claim is associated with a specific thread name and state
- Check “lock hold” and “lock pending” monitor addresses in lock race requirements
- Compare at least 3 snapshots and record the actual collection interval
- CPU usage requirements compare cumulative thread time and actual elapsed time (and operating system level data if available)
- Diagnoses that provide only abstract possibilities but have no evidence of stack traces, monitors, threads, or exceptions are rejected
- Mandatory reference to the evidence confirmed in the previous step to obtain the final revised ranking
If you want to specifically check out the memory/GC hypothesis, try using a dedicated service such as, say, GCeasy and analyze the relevant data. Parsing errors in the GC logs do not affect the validity of the valid thread dumps, so if there are no independent symptoms of memory anomalies, proven thread-level evidence should not be ignored.
Conclusion: LLM vs. Deterministic AI for Java Thread Dump Analysis
In this review, we examined the performance of the interactive analysis after the first thread dump study using four question phases. A general-purpose large-scale language model demonstrated the ability to consistently examine thread names, states, monitor addresses, resource locations, and runtime changes through inference. Learn more about reading and analyzing Java thread dumps.
The fact that the processing time clause needs to be slightly modified does not weaken the overall diagnosis, but rather reminds us of the importance of examining the original data. Deterministic analysis tools are still relevant in a limited or constrained scenario as the accuracy of the locked playback was remarkable. On the other hand, collateral analysis exposed the danger of pattern enumeration, unjustified inference, and tools’ identification bias. Most importantly, the correct answer to the first round does not mean that the next proposal will be correct. The main lesson I learned is that thread dump analysis conversational AI should be judged by the degree of continuity of evidence. By evidence, I mean the absence of “overreach” or “overuse” of technical terms. In other words, a correct response would highlight “provable facts” and “unprovable assumptions” and would adhere to such a standard during the pre-diagnosis correction loop. This approach is critical to auditing the automation process correctly and is beneficial to both parties if and when an actual performance incident occurs.