

This article is the continuation of our previous experiment, namely, GC Log Analysis Using Deterministic AI vs. LLM. In the previous experiment, we tested the same Java 21 GC log against GCeasy’s deterministic AI and compared it to the results of a general-purpose LLM. In the current experiment, we are going to evaluate the same approach but for thread dump analysis. Particularly, we are going to use the same thread dump snapshots and ask the same questions to get answers from both deterministic and non-deterministic AIs.
A comparison of verifiable analysis and LLM interpretation in a JVM environment.
Although the presented thread dump is truthful, the analysis results may prove misleading, as the raw data contains several blocked threads with circularly dependent monitor records that constantly run threads and correctly locked addresses. The challenge is to discern what threads are primary defects, secondary resource constraints, or normal operations.
Thread Dump Analysis involves reading and analyzing snapshots of all threads running on a Java virtual machine to describe the behavior of the application, for instance, freezing, excessive CPU load, or response delays. Each thread dump contains the status of all threads, including their current stack traces and monitor locks they have or are waiting to get. The correct analysis should translate that information into a set of statements that tell what exactly is going on in the executed application.
This thread dump analysis is comparing two different approaches for the same evidence: fastThread’s deterministic artificial intelligence, which works within the confines of yCrash, and a more general-purpose large-scale language model which consumes the raw dump directly. What we are seeking to evaluate is not so much a correct answer for this particular scenario – we could easily identify the right thing to say ourselves – but rather whether the system correctly finds the bug, preserves the evidential thread, avoids an unwarranted causal conclusion, and suggests a plausible course of action.
The result was not a clear case of a win-win proposition as one might expect. Both manual analysis and automatic procedure revealed some flaws in the process, although one was considerably more prone to misinterpretation of the data than the other.
How to Perform Repeatable Java Thread Dump Analysis
We built a simple Java-based application that includes specific thread identification and a particular level of concurrency. We also prepared three separate tasks:
- The deadlock check between two established threads;
- The looping task that relies on a certain central processing unit (CPU) usage;
- The lock contention task that utilizes the sleeping_threads {} while waiting for the monitor.
Setting Up a Java Application for Thread Dump Analysis
- Deadlock-Thread-1 and Deadlock-Thread-2: Both have one monitor and each requests the other monitor
- CPU Intensive -worker: Constantly performs tight loops
- Lock-Owner-Thread: Sleeping on the monitor
- Blocked – worker-1/2/3: Waiting to move to the same sync section
- Waiting-Worker and Timed-Waiting-Worker: Included to test if normal waiting conditions are misclassified
The program also calls Thread.currentThread().join() from the main thread. This seemingly insignificant detail becomes important later: it caused an infinite, deadlock-independent self-association.
Capturing Multiple Java Thread Dump Snapshots
With the JDK21 jcmd diagnostic command, we got three thread dumps approximately every 20-second interval, covering a total period of about 42 seconds.
jcmd <pid> Thread.print -l > thread-dump-1.txttimeout/t20/no breakjcmd <pid> Thread.print -l > thread-dump-2.txttimeout/t20/no breakjcmd <pid> Thread.print -l > thread-dump-3.txtMultiple snapshots allow you to distinguish between temporary and continuous modes. This collection method follows the practical recommendations for understanding Java thread dumps. Rather than relying on instant data, it compares multiple snapshots to build the perfect performance story.
Using a Neutral Prompt for Thread Dump Analysis
Both analytics systems received the same initial request from the same three text files. The prompt does not mention a deadlock, high CPU, blocked employee, or thread name:
- Analyze the associated Java thread dump
- Identify key issues
- Explain the root cause based on evidence from the thread dumps
- Make viable recommendations
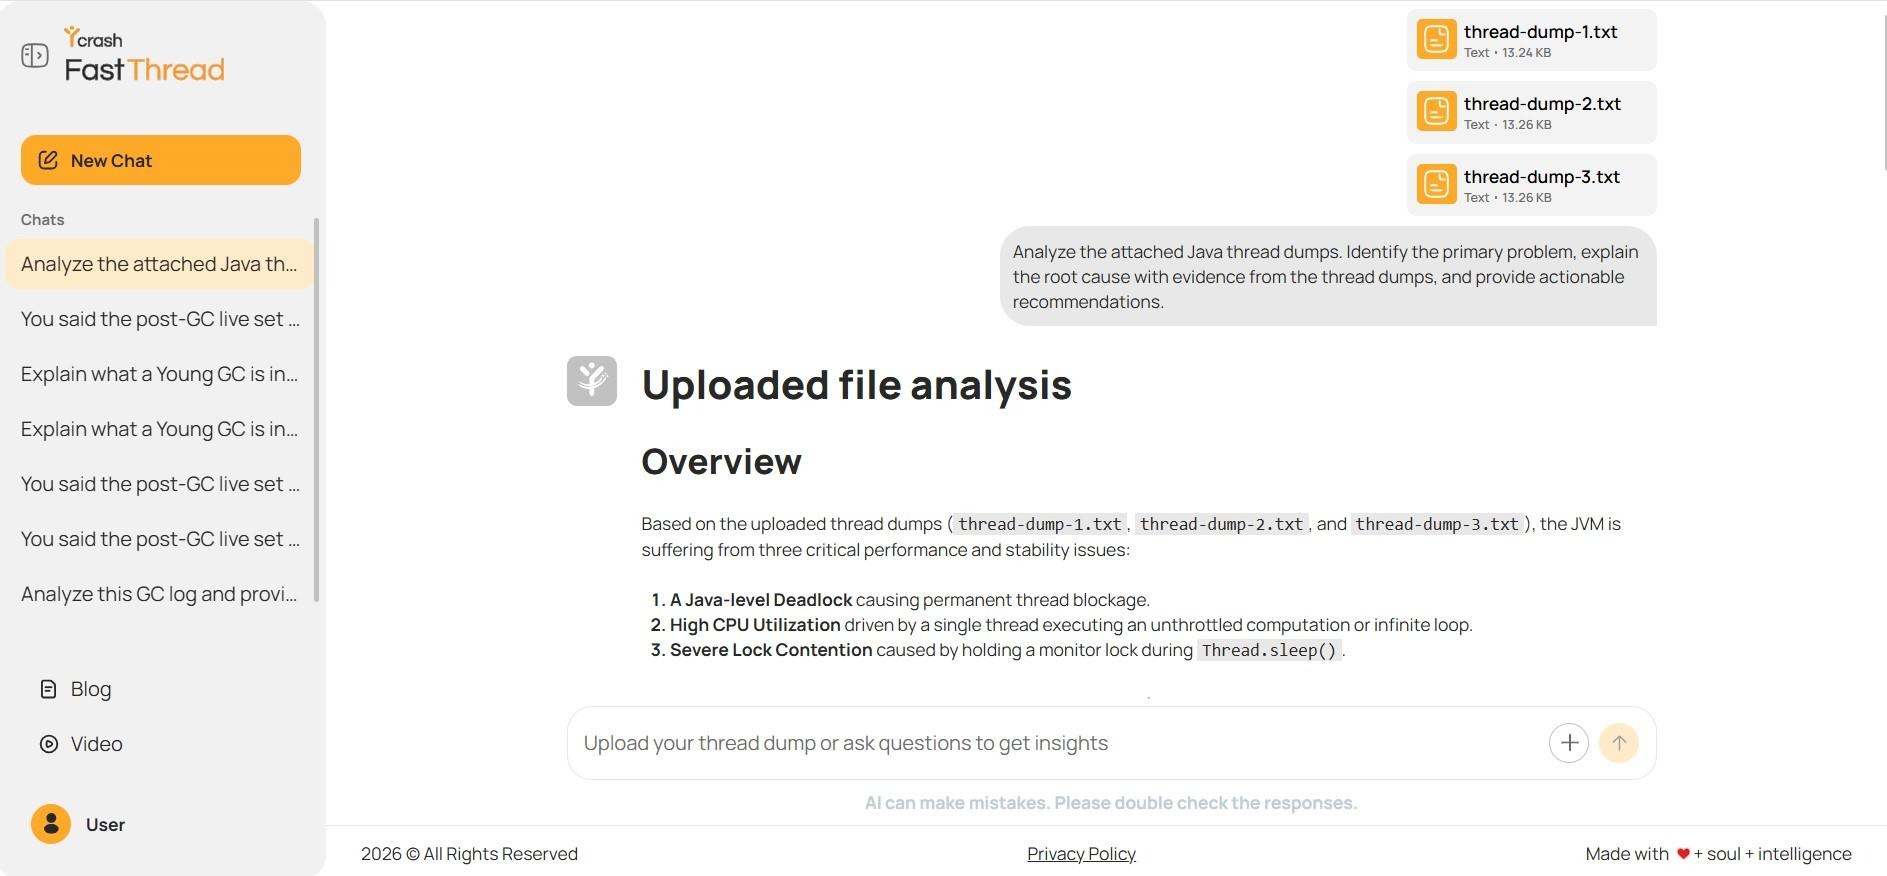
Fig: Three snapshots and neutral instructions sent to fastThread‘s deterministic AI
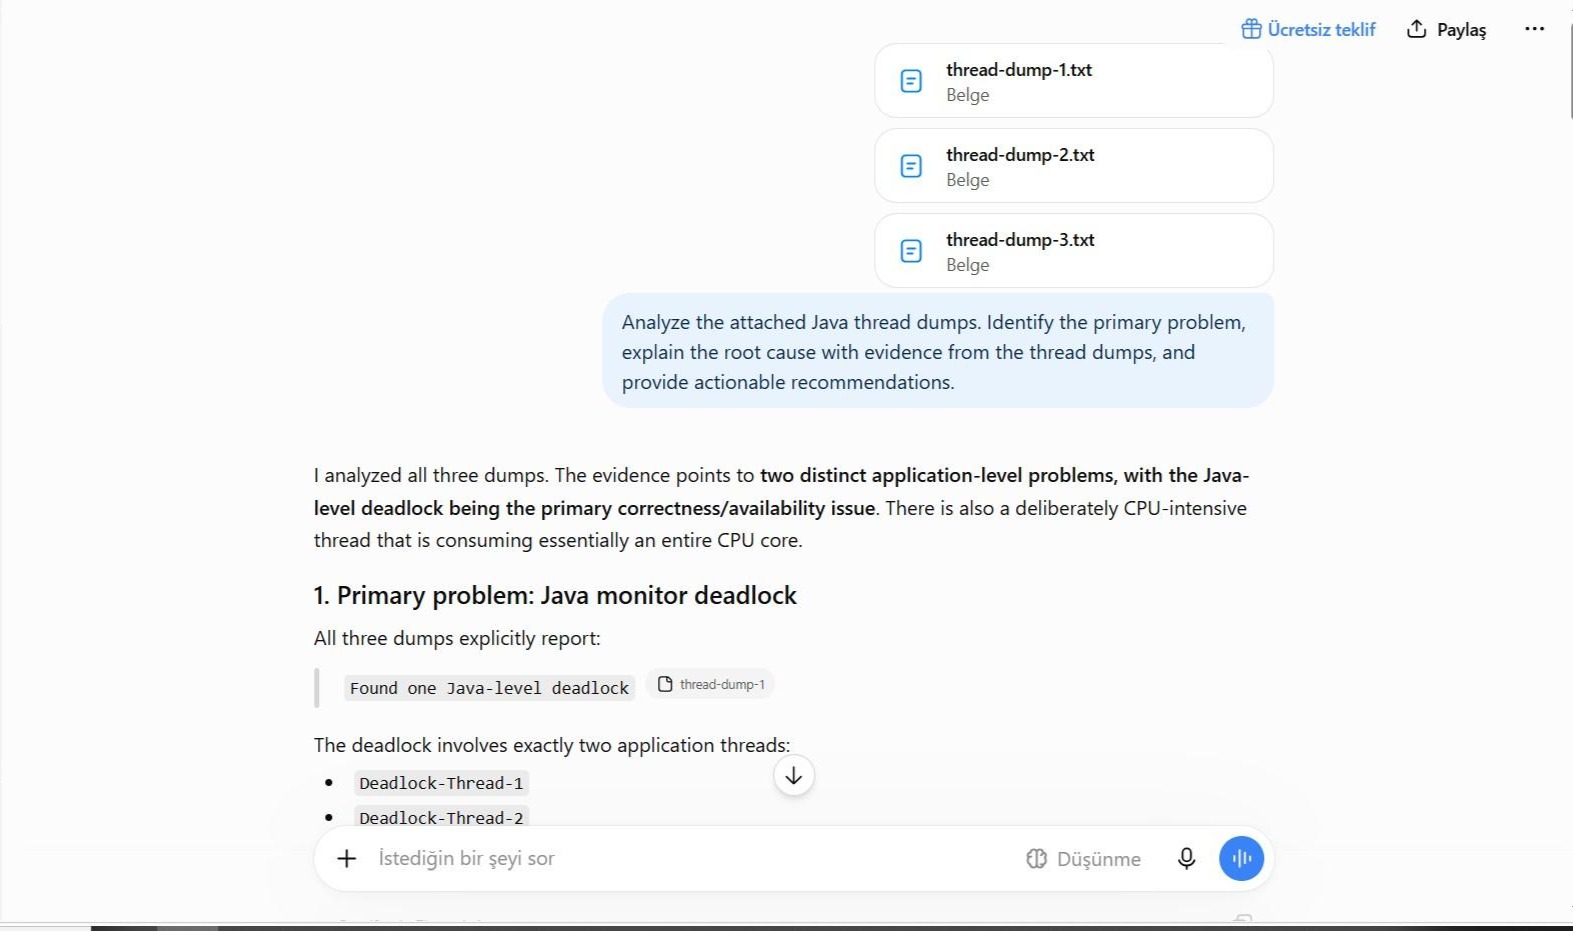
Fig: The same file and instructions are delivered directly to the general LLM
Deterministic AI Thread Dump Analysis Results
From the very beginning, the deterministic analysis has revealed three findings independent of one another that have not pushed all symptoms into one diagnosis: Java-level deadlock, near saturation of a CPU with almost a sole core, and persistent lock contention. Such distinction is important and critical, because the impact of each situation on the system and the resolution method is different to an enormous extent.
Detecting Java Deadlocks and Circular Lock Dependencies
The analysis report detected not only “deadlock Thread-1” and “deadlock Thread No. 2”, but also preserved the explicit ownership chain of the JVM to the maximum degree. The first thread was in the waiting state for the 0x0000000711de9150 lock, while owning the 0x0000000711de9140 monitor; Deadlock-Thread-2 owned the 0x0000000711de9150 monitor while trying to acquire the 0x0000000711de9140 lock.
"Deadlock-Thread-1" ... java.lang.Thread.State: BLOCKED - waiting to lock <0x0000000711de9150> - locked <0x0000000711de9140> at ...DeadlockApp.java:126"Deadlock-Thread-2" ... java.lang.Thread.State: BLOCKED - waiting to lock <0x0000000711de9140> - locked <0x0000000711de9150> at ...DeadlockApp.java:143The excerpt shows that Deadlock-Thread-1 and Deadlock-Thread-2 have a circular lock dependency between each other, which leads to a deadlock.
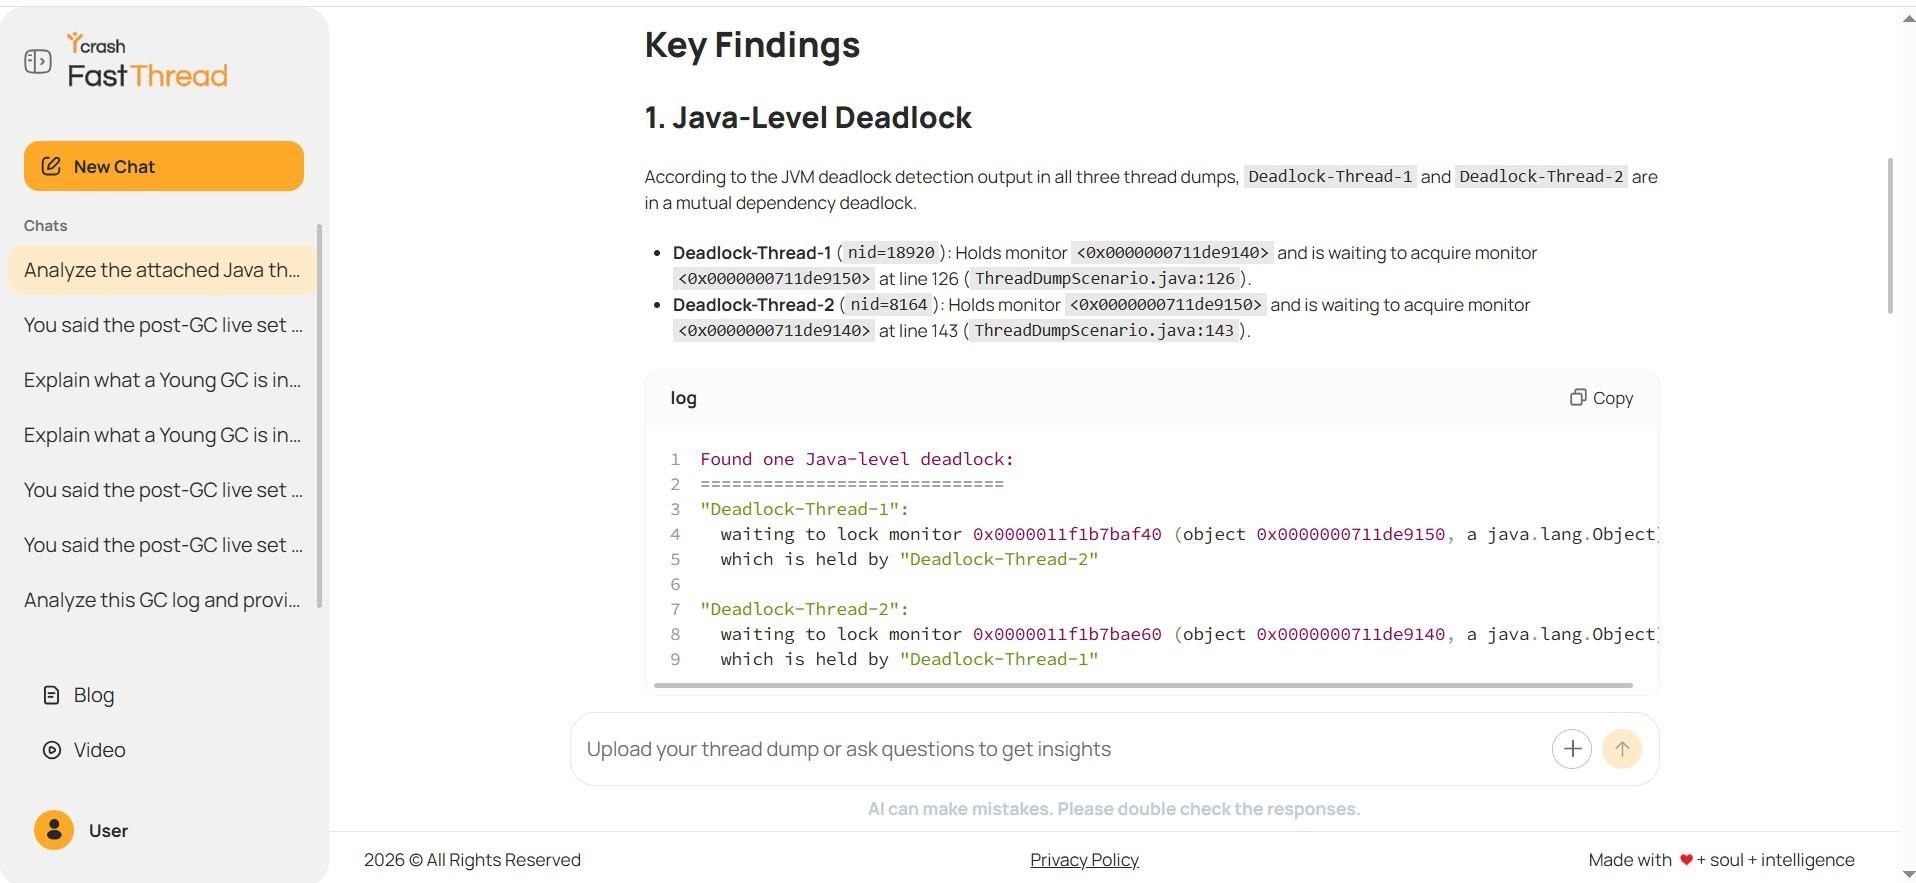
Fig: Follow the ownership and two-thread lock-ownership cycle
Identifying CPU Saturation and Lock Contention
During the three snapshots, “CPU Intensive Thread” cumulatively consumed 81.63 seconds, 103.44 seconds, and 123.80 seconds of CPU time, but program execution time progressed at roughly the same rate: proof that the single-core CPU was being bullied.
At the same time, Lock-Owner-Thread remained in the TIMED_WAITING state while holding monitor 0x0000000711de9120. As a result, Blocked-Worker-1, Blocked-Worker-2, and Blocked-Worker-3 remained in the BLOCKED state while waiting to acquire the same monitor. FastThread correctly classified this occurrence as persistent lock contention, not part of deadlock cycle. According to Oracle’s official Thread State documentation, the BLOCKED state means that a thread is waiting to acquire a monitor lock. However, this is not necessarily a case of deadlock, but rather a scenario when a resource is used in a way that requires threads to wait for each other to release it.
"CPU-Intensive-Worker" ... java.lang.Thread.State: RUNNABLE cpu=81.63s -> 103.44s -> 123.80s"Lock-Owner-Thread" ... java.lang.Thread.State: TIMED_WAITING (sleeping) - locked <0x0000000711de9120>"Blocked-Worker-1" ... java.lang.Thread.State: BLOCKED - waiting to lock <0x0000000711de9120>The excerpt shows that the CPU is constantly used, and there are some lock contention issues as one of the threads sleeps while holding the monitor.
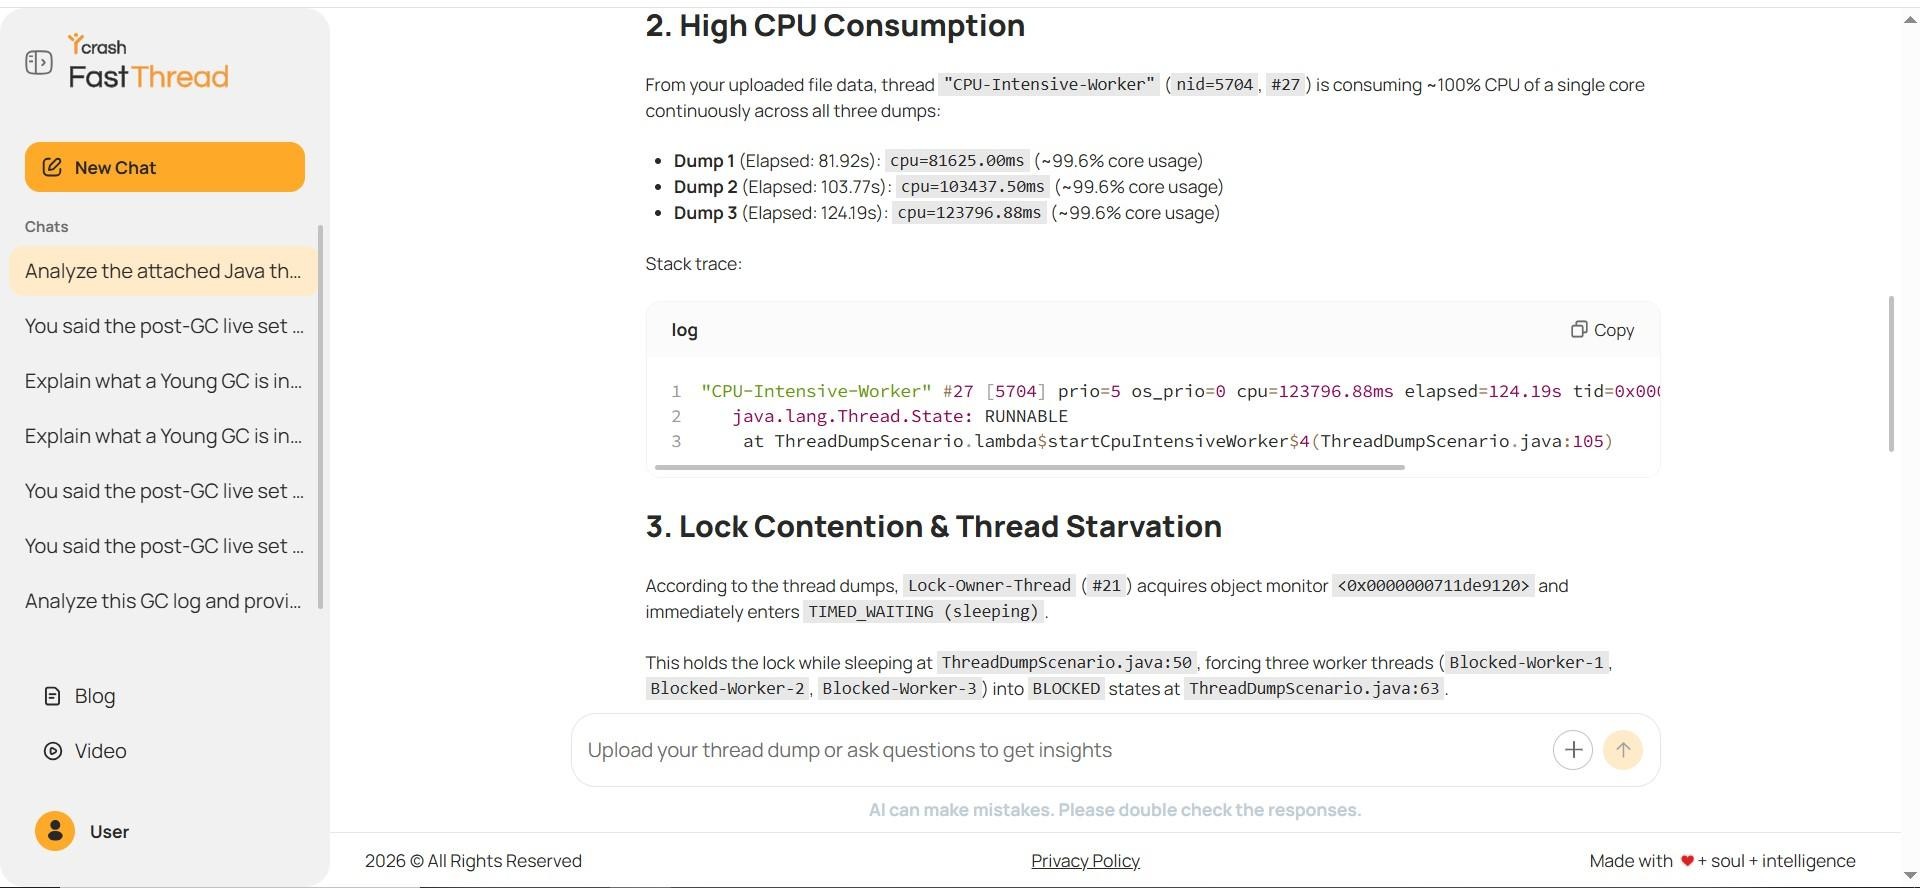
Fig: Permanent CPU consumption and monitor contention detected from the same snapshot
Recommendations for Resolving Java Thread Dump Issues
This detective has given us plenty of hints for solving the case. Our suggestion is to use the same lock order each time and always use ReentrantLock.tryLock(), remove the sleeps and I/O from the synchronized block, and add the exit and background conditions to the processor loop. We have formulated our answer on the basis of analyzing the particular case.
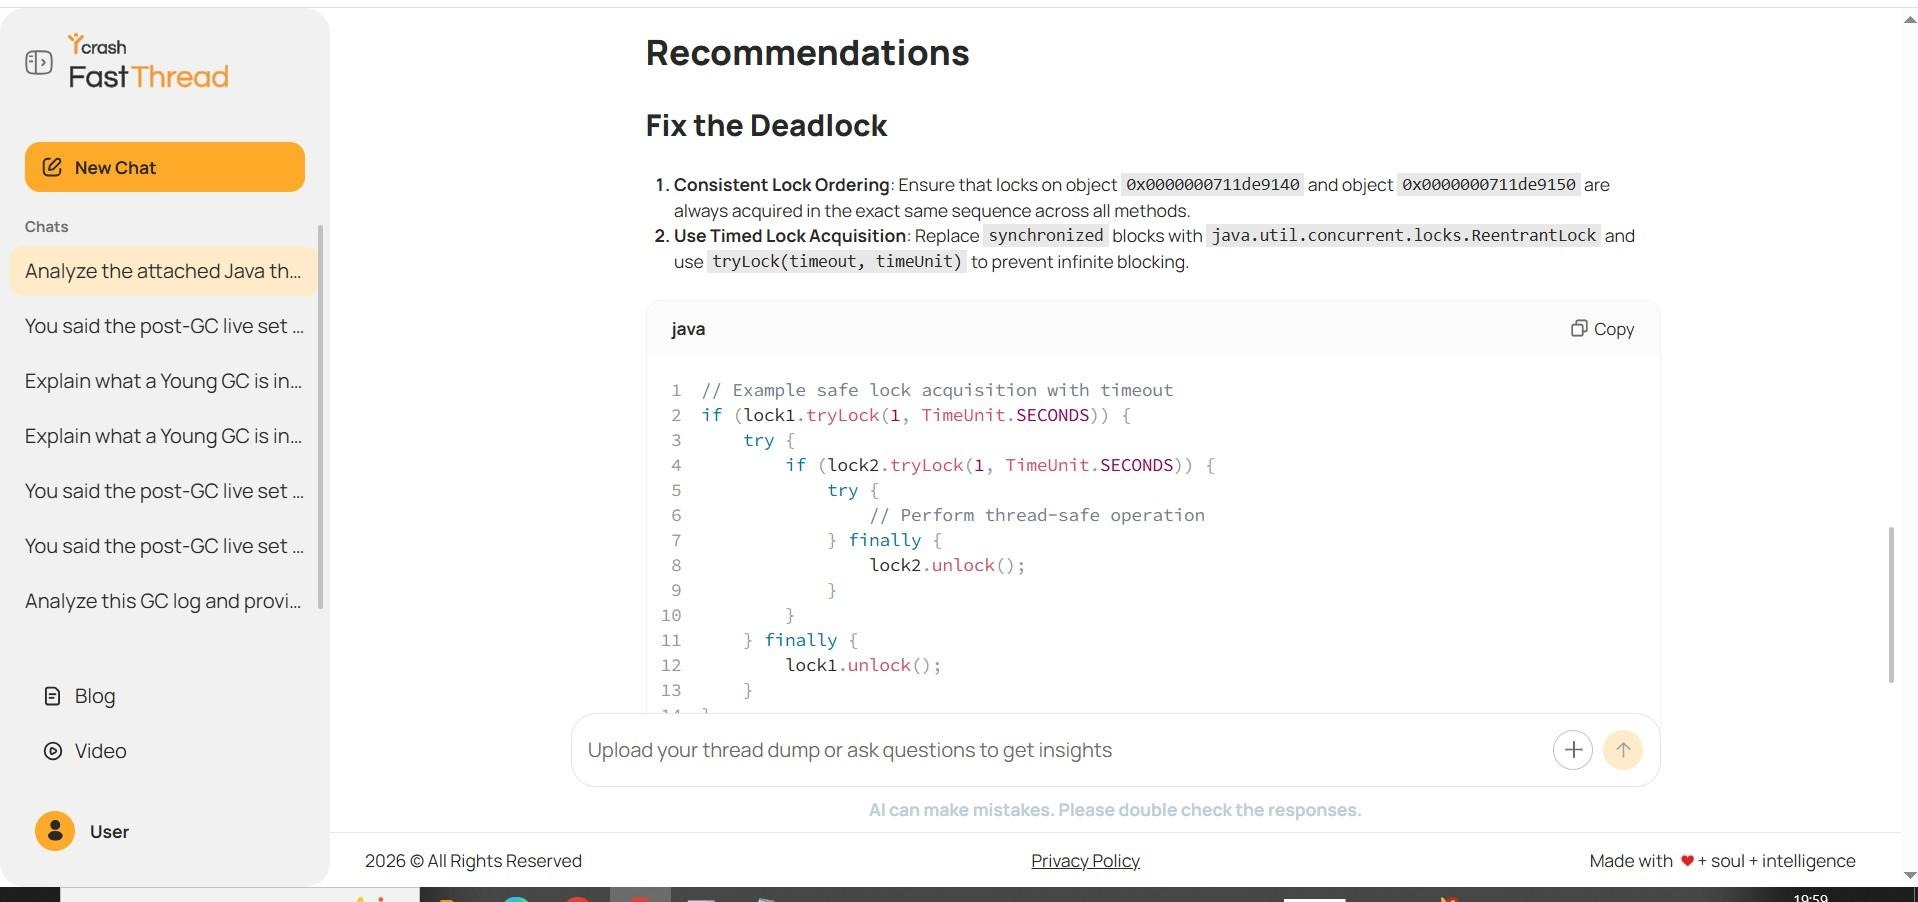
Fig: Clues to specific measures leading to a deadlock in a specific analysis
LLM-Based Java Thread Dump Analysis Results
The general-purpose LLM also showed excellent diagnostic abilities. We detected Java-level deadlock, reconstructed lock cycles, identified CPU-intensive workers, and separated competitors from deadlock. In addition, people were reminded in a timely manner that standby was not automatically a fault. The explanation is clear and convincing.
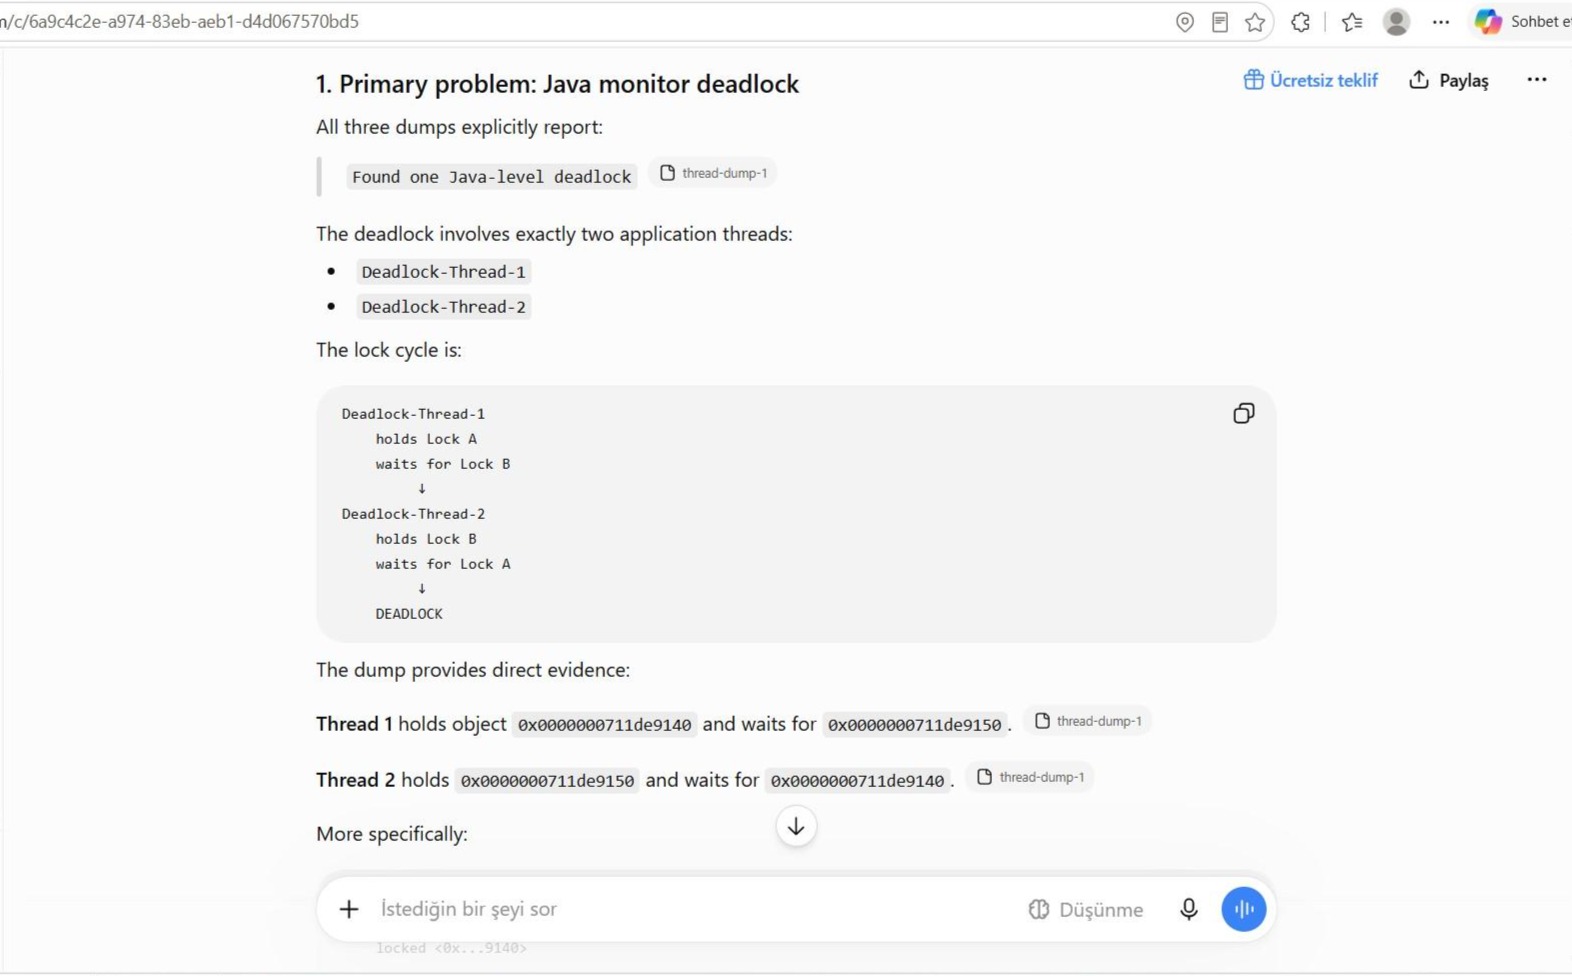
Fig: LLM reconstructed deadlock structure from native monitor logs
Identifying Inconsistent Lock Acquisition Order
The LLM correctly identified inconsistent lock acquisition order as the root cause. It proposed one global order for all paths that need both locks and suggested redesigning the critical section if nested locking can be removed.
synchronized (lockA) { synchronized (lockB) { // work }}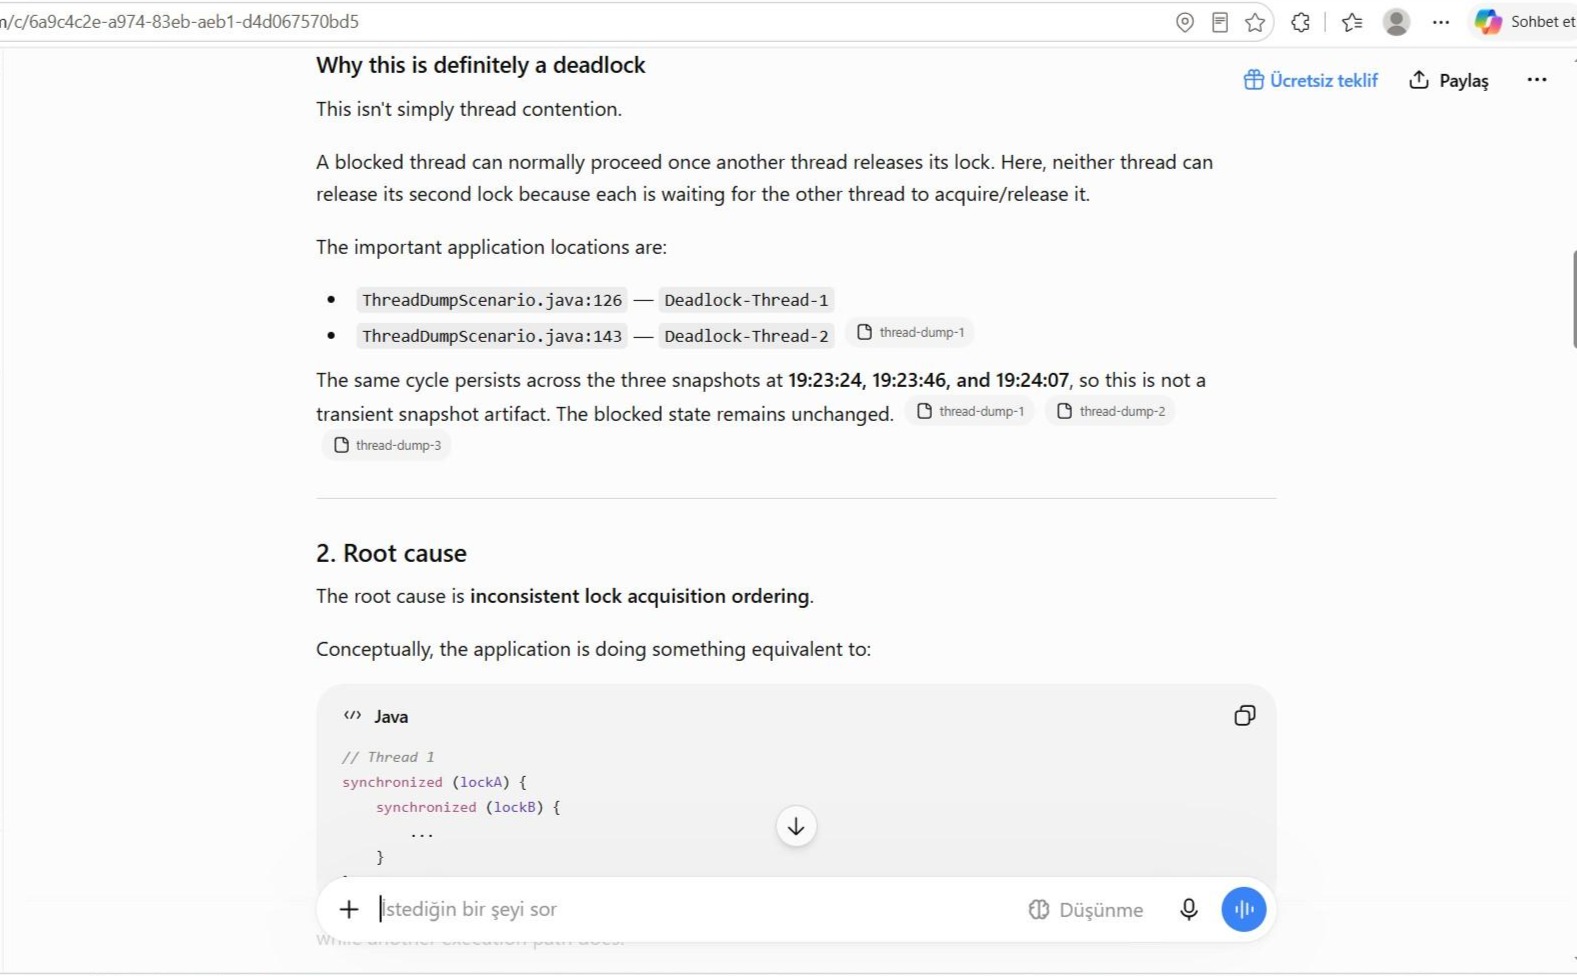
Fig: The LLM relates the circular wait to inconsistent lock-acquisition order.
Distinguishing Normal Waiting from Thread Dump Problems
Model analysis has one major advantage. It is the ability to accurately grasp the state of the surrounding thread. The report clearly states that the Waiting-Worker intentionally waits by executing Object.wait(), and the Timed-Waiting-Worker thread is intentionally dormant. None of these statuses are associated with a primary incident. This difference is important because it avoids the common mistake that all inactivity is treated as a problem in routine thread-dump analysis.
Identifying Incorrect Causal Relationships in LLM Analysis
The biggest mistake was made in interpreting the main thread. As per the analysis report, the main thread waits for other threads to finish, but it states that the deadlock prevents the program from finishing successfully. But upon close inspection of the stack trace, it can be seen that it actually calls Thread.currentThread().join(). That means that the main thread is waiting for itself! Thus, even if the deadlock between the two worker threads is resolved, the program will still hang at the end.
This seemingly small misreading led to a significant diagnostic error. Although the model correctly picked up the WAITING mode and the join () invite stack, it arbitrarily created a false connection between waiting and locking when there was no such connection. It can be said that the exact facts have been transformed into an inaccurate causal story.
Deterministic AI vs. LLM for Java Thread Dump Analysis
The table below compares three dimensions: fact extraction, interpretation of the phenomenon, and suggestions for correction. While both approaches performed well in transparent evidence identification, the areas where they made mistakes were completely different.
The deterministic analyzer breaks down each thread into its component fields (state, native thread ID, stack trace, monitors owned, and CPU time) and cross-references them across snapshots. Meanwhile, a general-purpose LLM would read the serialized version of the heap dump and attempt to concoct a (potentially spurious) causal story connecting the evidence, unless it has been given specific instructions to the contrary.
Comparing Deterministic AI and LLM-Based Thread Dump Analysis
The comparison below represents the findings that were consistent throughout the three thread dump samples.
- JVM reported a permanent Java-level deadlock in all three snapshots.
- This loop queue had two monitor objects, the same two threads, and the same two monitor objects.
- CPU-intensive worker threads continued to consume almost the full amount of core resources.
- Three work cycles were prevented by sleeping while holding the monitor. Therefore, this behavior must be eliminated.
- Ensuring a consistent locking sequence is the first improvement you need to make.
Advantages of Deterministic Java Thread Dump Analysis
Deterministic analysis first classified all three problems and presented their findings based on structured metrics. They also avoided adding causal claims from the main thread. This is the main advantage of deterministic analysis. This means that instead of reconstructing an unverified relationship from scratch, you can start with a confirmed relationship.
Advantages of LLM-Based Java Thread Dump Analysis
The LLM was able to explain the concept more clearly, including the difference between a deadlock and normal contention. We also suggested using JFR and Async Profiler to address benign waiting spaces in more detail and perform detailed configuration analysis of CPUs in real-world applications. These strengths will help engineers communicate what they find and decide what to explore next.
Here’s a quick comparison table:
| Assessment Dimension | Deterministic Analysis | Generic Giant Language Model |
|---|---|---|
| Locking detection | Correct | Correct |
| Lock Hold Mode | Accurate Cycle Monitoring | Accurate Cycle Monitoring |
| Processor Heavy Thread | Right (Including Trend Indicators) | Right (Comparison between Actual Value and CPU Usage) |
| the main thread | does not create erroneous causal relationships | and incorrectly associates the waiting itself with a deadlock |
| Problem statistics | 3 different types of independent problems | were initially reported as 2 types, later corrected by adding a competition analysis. |
| Version suggestions | Immediate launch (including test cases) | Detailed guide to analyzing performance and ordering locks |
Why Evidence-Based Thread Dump Analysis Matters in Production
This test does not show that general LLMs cannot perform a thread dump analysis.In fact, the LLM found almost all of the issues implemented. High frequency and reliable causality, however, are not the same. One unconfirmed relationship may lead to an incorrect thread of inquiry or a lifecycle event.
Safer workflows are hierarchical. First, it deterministically picks up the state of the thread, ownership of the monitor, repetitive stack positions, CPU time differences, and deadlock cycles. We use conversational AI to explain these validated facts, reformulate the assumptions, and translate them into a research plan. The same principle is presented in the webinar on Java thread dump analysis with deterministic AI. In other words, the validated analysis has to take place before proceeding with the generative interpretation.
Java Thread Dump Analysis Checklist for Production Troubleshooting
Use this checklist to verify the thread dump results and ensure that you do not draw incorrect conclusions based on incomplete evidence.
- Check if the JVM has explicitly reported a deadlock.
- Before identifying the root cause, check with the owner of all pending displays.
- Compare at least 3 snapshots before claiming the thread is stuck.
- Treat blocked, expected, scheduled waiting as a state, not a conclusion.
- Claims of causation are validated based on both stack marks and application code.
- Distinguish between risks that are not immediately available and secondary performance bottlenecks.
Conclusion: Deterministic AI vs. LLM for Java Thread Dump Analysis
This article compared deterministic analysis to direct interpretation of LLMs using controlled thread dump analysis. Both methods correctly detected deadlock between two threads, continuously executing CPU workers, and controlling conflicts affecting three blocked workers. LLMs provided clear explanations and useful profiling advice, while deterministic analysis provided a better separation of problems and a stricter thread of evidence.
The crucial difference was not whether the tool would find an obvious deadlock. The difference lies in whether the evidence still supports each conclusion. LLM’s interpretation of the main thread showed that false causation claims can arise even in the right space or in a stack frame. The most effective model for troubleshooting in a production environment is the complementary model. In other words, we establish confirmed facts by deterministic analysis and then use discussion-based reasoning to examine these facts without relaxing the evidence.
In the second experiment, we will go a step further and evaluate the responses to deterministic AI and an LLM to conversational, follow-up questions about the same thread dump evidence.



Share your Thoughts!