
A major travel organization in North America faced a recurring issue with one of their critical microservices. The application, which was essential for handling high traffic, would become unresponsive just a few hours after going live. This posed a significant challenge for the Site Reliability Engineering (SRE) team, who struggled to identify the root cause. To gain deeper insights and resolve the issue quickly, the team captured a thread dump and analyzed it using fastThread.
The Challenge
The microservice was becoming unresponsive after hours of traffic, severely affecting the organization’s operations. The SRE team was in the dark regarding the root cause. Faced with increasing downtime and the need for quick resolution, the team turned to fastThread for a comprehensive analysis of their thread dump.
Solution: fastThread to the Rescue
When the SRE team uploaded the thread dump to fastThread, the tool immediately delivered critical insights on the root cause of the microservice’s unresponsiveness. The fastThread analysis revealed a surprising finding: the microservice had a staggering 3,216 active threads, far exceeding its normal operating range. This thread count spike was a clear signal that the system was struggling under the weight of an unexpected issue.

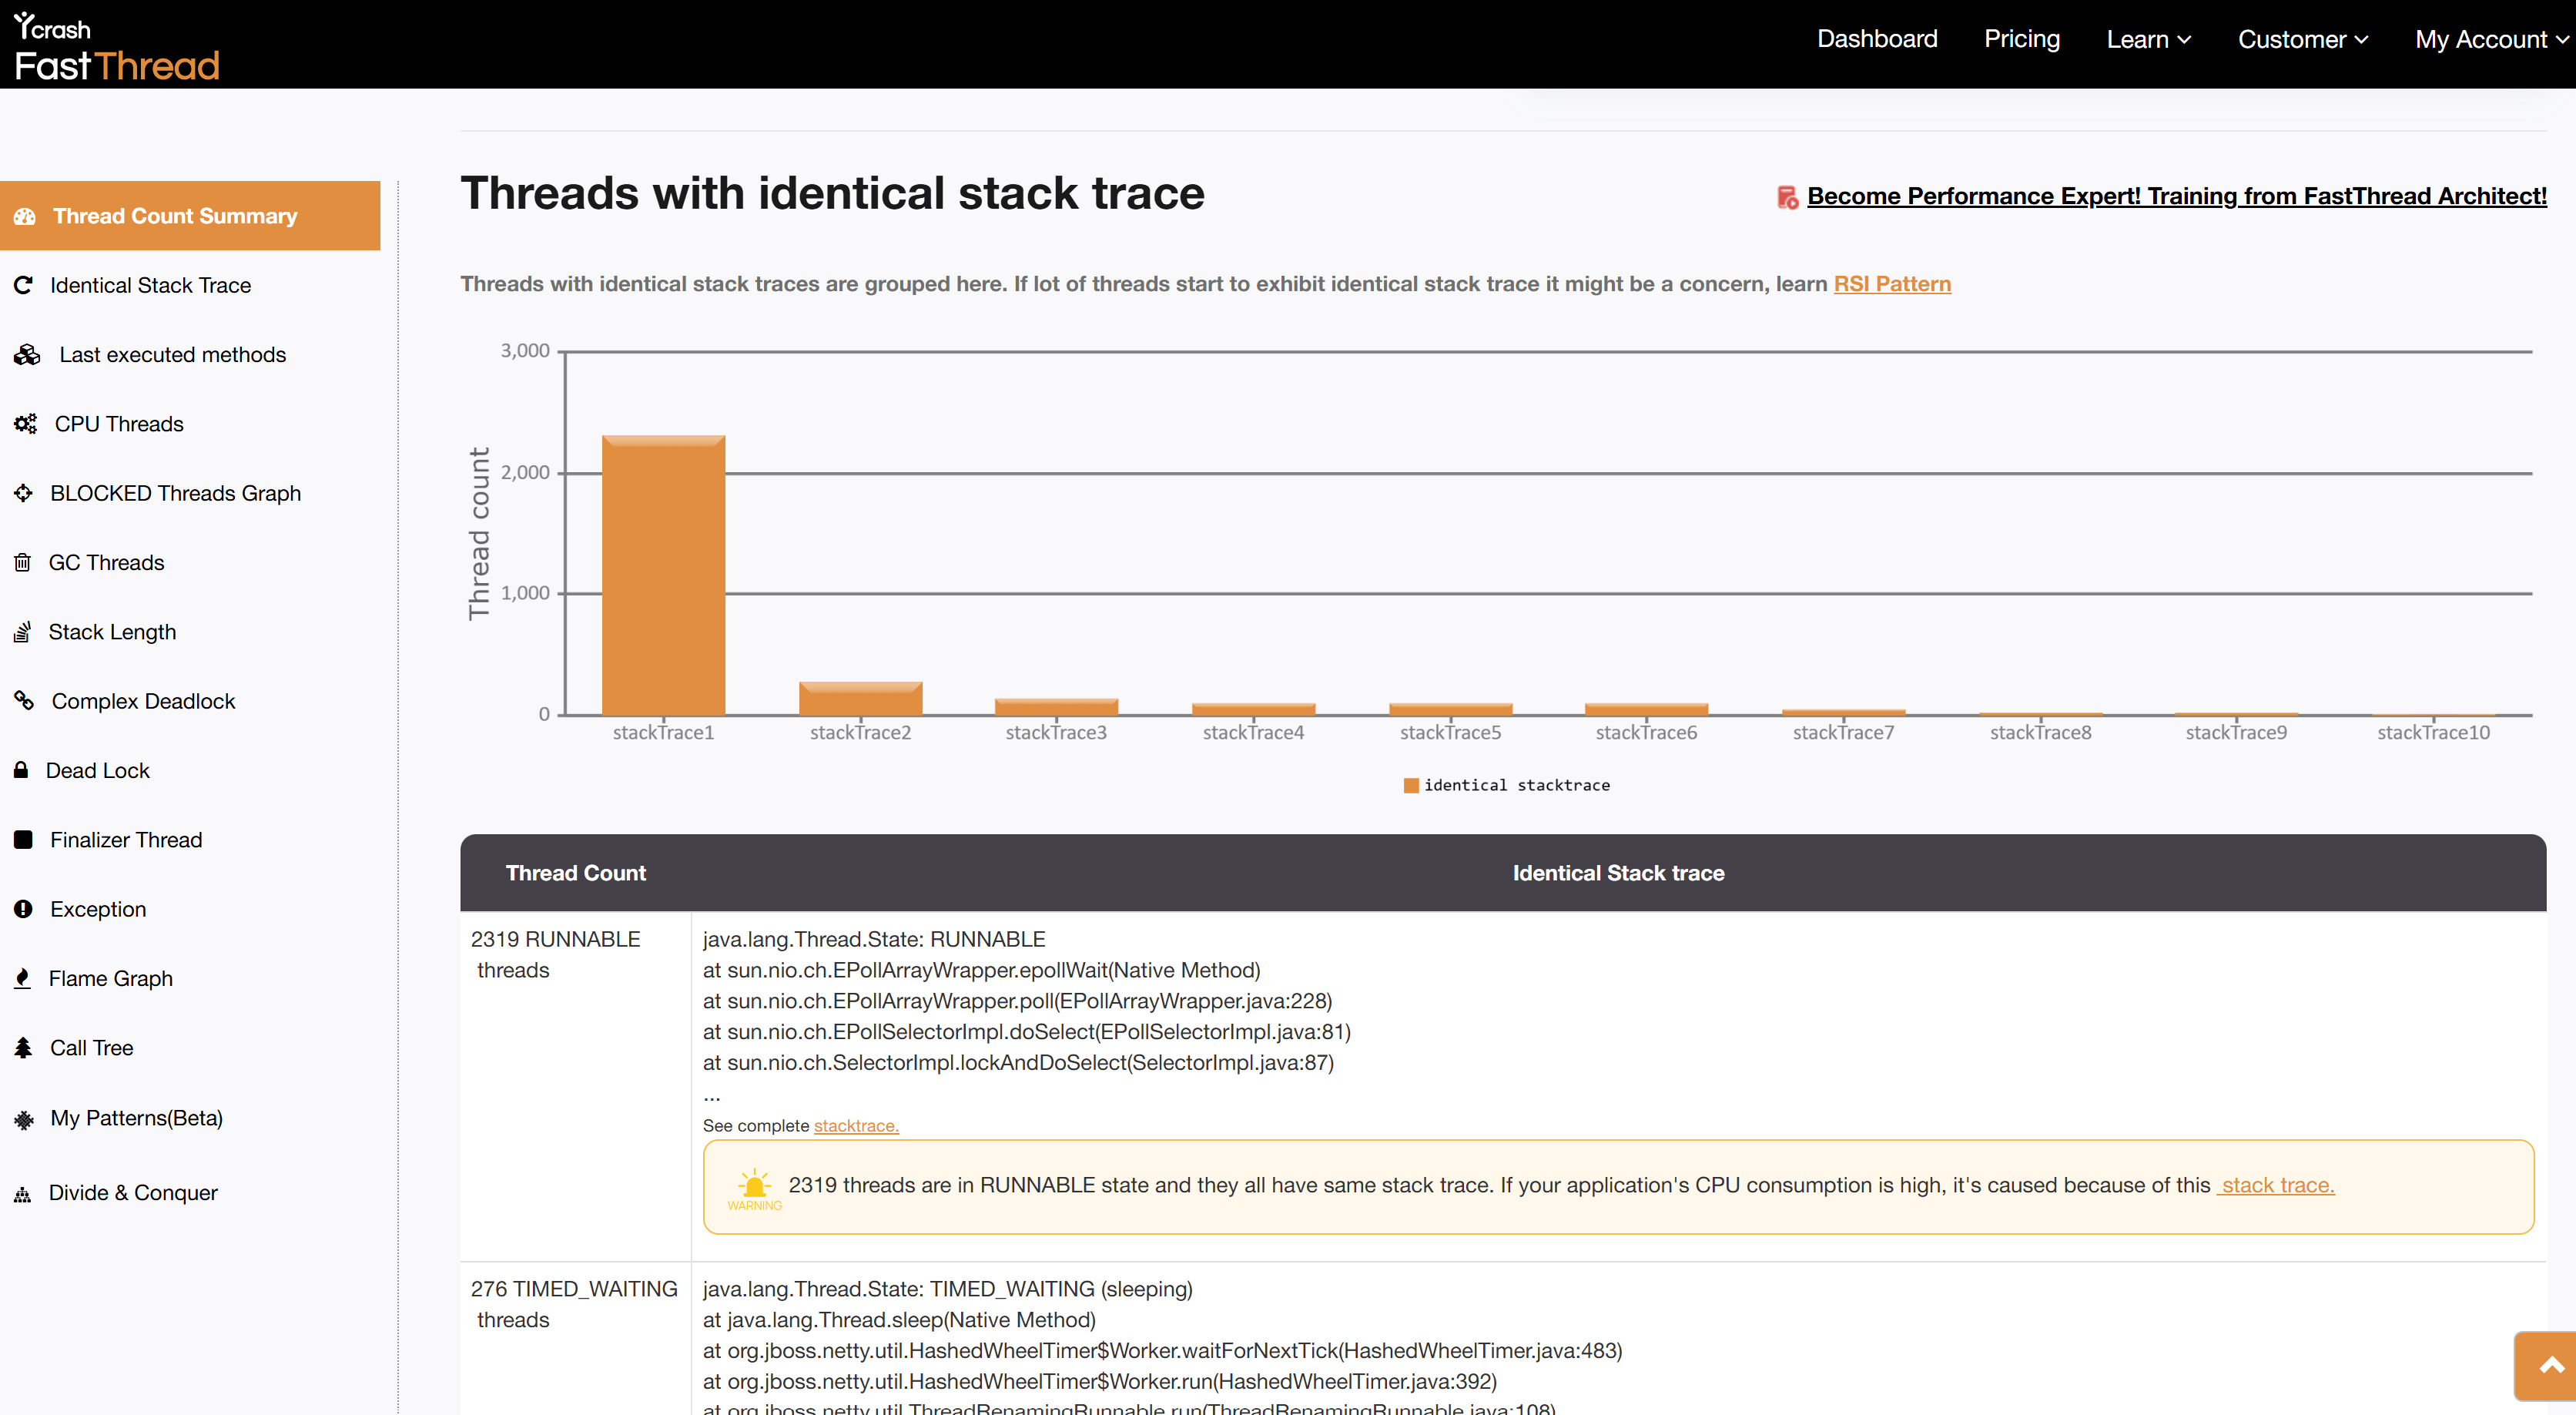
What made fastThread particularly valuable in this case was its ability to transform complex data into a clear, actionable format. One standout feature was the ‘Repeating Stack Traces’ section, which automatically groups identical stack traces and displays the number of threads that share the same trace. Instead of requiring the SRE team to manually review thousands of individual stack traces, fastThread presented a concise view of recurring patterns. In this case, it revealed that 2,319 threads (i.e. 72% of the total threads), were stuck at the exact same point in the code. This insight alone saved the team from several hours of manual investigation and pointed them directly to the bottleneck.
Key Details of the Stuck Threads
fastThread’s analysis went beyond surface-level metrics, providing the SRE team with detailed insights into where the 2,319 threads were getting stuck. The tool revealed that all these threads were all waiting for network responses. Specifically, they were stuck in the EPollArrayWrapper, a native method used for asynchronous I/O in Linux systems. This critical information pointed directly to a bottleneck at the network layer.
Below is the stack trace from one of the 2,319 stuck threads:
java.lang.Thread.State: RUNNABLE
at sun.nio.ch.EPollArrayWrapper.epollWait(Native Method)
at sun.nio.ch.EPollArrayWrapper.poll(EPollArrayWrapper.java:228)
at sun.nio.ch.EPollSelectorImpl.doSelect(EPollSelectorImpl.java:81)
at sun.nio.ch.SelectorImpl.lockAndDoSelect(SelectorImpl.java:87)
- locked <0x00000007b3a0a870> (a sun.nio.ch.Util$2)
- locked <0x00000007b3a0a860> (a java.util.Collections$UnmodifiableSet)
- locked <0x00000007b3a0a640> (a sun.nio.ch.EPollSelectorImpl)
at sun.nio.ch.SelectorImpl.select(SelectorImpl.java:98)
at org.jboss.netty.channel.socket.nio.SelectorUtil.select(SelectorUtil.java:68)
at org.jboss.netty.channel.socket.nio.AbstractNioSelector.select(AbstractNioSelector.java:415)
at org.jboss.netty.channel.socket.nio.AbstractNioSelector.run(AbstractNioSelector.java:212)
at org.jboss.netty.channel.socket.nio.AbstractNioWorker.run(AbstractNioWorker.java:89)
at org.jboss.netty.channel.socket.nio.NioWorker.run(NioWorker.java:178)
at org.jboss.netty.util.ThreadRenamingRunnable.run(ThreadRenamingRunnable.java:108)
at org.jboss.netty.util.internal.DeadLockProofWorker$1.run(DeadLockProofWorker.java:42)
at java.util.concurrent.ThreadPoolExecutor.runWorker(ThreadPoolExecutor.java:1145)
at java.util.concurrent.ThreadPoolExecutor$Worker.run(ThreadPoolExecutor.java:615)
at java.lang.Thread.run(Thread.java:722)
This repeating stack trace highlighted that the 2,319 threads were stalled at the network layer, waiting indefinitely for a response. This provided a key clue in diagnosing the underlying issue, narrowing down the focus for further investigation.
Root Cause Discovery
As the SRE team delved deeper, guided by fastThread’s analysis, they discovered that the threads originated from the DataStax driver—a driver used by the microservice to connect to an Apache Cassandra NoSQL database. Normally, the driver opens and manages network connections to Cassandra nodes, but in this case, something was causing the driver to open an excessive number of connections and spawn more threads than the system could handle.
The root cause became clear when the team inspected the Cassandra nodes. One of the nodes was suffering from a critical disk space shortage, which was severely impacting its ability to process requests. As the disk space dwindled, the node became slower and more unreliable, leading the DataStax driver to open additional connections in an attempt to compensate for the poor performance. Unfortunately, instead of alleviating the issue, this only made the problem worse. With every new connection, more threads were spawned, overwhelming the JVM and eventually causing the entire microservice to become unresponsive.
Armed with the precise information provided by fastThread, the SRE team immediately allocated additional storage to the impacted Cassandra node, resolving the disk space issue that had triggered the cascade of thread failures. Once the disk space was increased, the microservice’s performance returned to normal. The thread count dropped back to expected levels, and the JVM, freed from the overwhelming load.
Benefits of fastThread: A Swift and Effective Resolution
What could have been a prolonged outage was resolved in a fraction of the time, thanks to the insights delivered by fastThread. By guiding the team to the exact root cause, fastThread enabled a quick and effective resolution that restored the microservice’s responsiveness and ensured the stability of the system moving forward.
Key Benefits of fastThread in this case:
- Rapid identification of the root cause: fastThread’s thread clustering quickly revealed excessive thread creation due to database connection failures.
- Actionable insights: The tool pinpointed the specific resource bottleneck, enabling the team to resolve the issue efficiently.
- Prevention of future outages: With fastThread’s clear reporting, the organization implemented fixes that prevented recurring issues, leading to long-term system stability.
Conclusion
Thanks to fastThread’s deep thread dump analysis capabilities, the travel organization was able to swiftly resolve a critical performance issue. fastThread not only helped identify the bottleneck but also provided the insights needed to prevent future problems, ensuring the microservice could handle high traffic without further incidents.


3 Pingback