
A major financial institution in North America experienced a serious issue with its middleware application, which serves as the backbone of various banking channels, including their online banking, mobile banking, ATMs, and call centers. As a vital component of their operations, any downtime in the middleware would cause newspaper headlines for that institution.
Despite its importance, the middleware application encountered an alarming outage. After a few hours of handling normal traffic, the application would become unresponsive, causing significant delays. The Site Reliability Engineering (SRE) team has to keep restarting the JVMs across their data center to keep the site up. The team also struggled to identify the root cause. To investigate further, they captured a thread dump and turned to fastThread for a detailed analysis.
The Challenge
The middleware application was becoming unstable after a few hours of operation, leading to service disruptions. This instability left the SRE team with little insight into what was going wrong. Although they captured thread dumps, manually analyzing them proved insufficient for diagnosing the issue. They needed a faster, more reliable way to understand the cause behind the growing unresponsiveness.
Solution: fastThread to the Rescue
Using fastThread, the SRE team analyzed the captured thread dump and discovered a critical problem. The analysis revealed that the application had 1,859 active threads at the time of taking thread dump – an unusually high number for this middleware. Normally, the application had a much lower thread count, which pointed to an abnormal spike in threads, clearly signaling a deeper issue.

One of fastThread’s key features, ‘Repeating Stack Traces,’ helped identify that 1,706 threads—representing 92% of the total active threads—had identical stack traces. This clustering of threads indicated that a significant portion of them were stuck at the same operation, likely contributing to the bottleneck that was affecting the entire application.
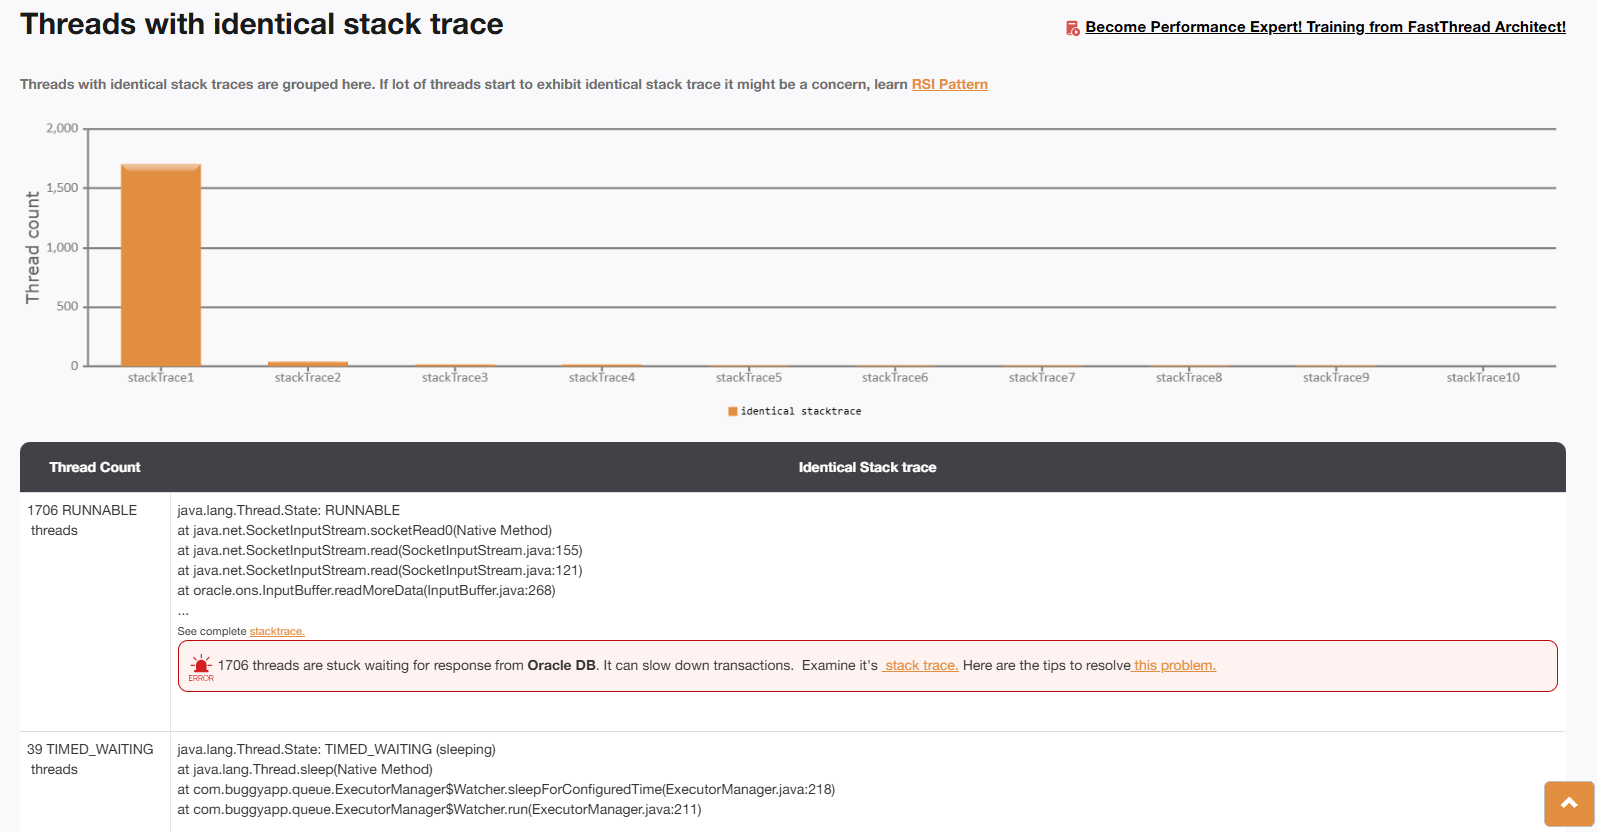
Here is the real thread dump analysis report generated by the fastThread tool for this middleware application. Class names in the stack trace have been anonymized for security purposes.
Implementation and Results
Upon examining the fastThread analysis, the tool highlighted the stack traces of the 1,706 repeating threads. These stack traces clearly indicated that the threads were originating from the Oracle JDBC driver. The application had enabled the ‘Online Notification Service’ (ONS) flag, a feature recommended by Oracle to improve availability. However, due to a bug in the JDBC driver, each backend call was spawning a new thread that never terminated. Over time, these excessive threads accumulated, eventually overwhelming the JVM and causing the application to become unresponsive.
Armed with this information, the SRE team escalated the issue to their database vendor, who confirmed the bug in the JDBC driver. The vendor released a patched version of the driver, which resolved the issue once installed. Following the update, the middleware application stabilized, preventing further unresponsiveness and ensuring smooth operations going forward.
Benefits of fastThread
fastThread not only helped diagnose the root cause of the application’s instability but also empowered the team to resolve the issue faster than anticipated. The SRE team could pinpoint the problem in a matter of minutes, saving hours of manual effort.
Key Benefits:
- Rapid diagnosis of thread-related bottlenecks
- Ability to identify repeating patterns in thread behavior
- Clear insights into the root cause of the issue, leading to a faster resolution
Conclusion
Thanks to fastThread, the financial institution was able to restore stability to its middleware application and avoid further outages. The tool’s powerful thread dump analysis capabilities ensured that their team could rapidly identify and resolve thread-related performance issues. If your application is facing similar thread bottlenecks or performance problems, fastThread could help you achieve similar success.

6 Pingback