
Microservices architecture provides several advantages, such as improved scalability, flexibility to experiment, faster time-to-market, and the ability to use different programming languages and technologies. However, it also introduces complexities, especially when troubleshooting performance issues. Microservices can experience a range of problems, including long garbage collection pauses, deadlocks, blocked threads, and CPU contention.
One of the most effective ways to identify and resolve such performance issues is through thread dump analysis. Whenever a microservices application encounters a performance problem, it often manifests in the behavior of its threads. By analyzing thread dumps, you can pinpoint the root cause and gain valuable insights into the performance issues affecting your microservices architecture.
In this post, we’ll discuss how to capture and analyze thread dumps to efficiently troubleshoot performance problems in microservices applications.
What is a Thread Dump?
A thread dump is a snapshot of all the threads running in a Java Virtual Machine (JVM) at a particular moment. It provides detailed information like thread names, states, IDs, the lines of code each thread is executing, and any locks held or waiting to be acquired. This data is invaluable for diagnosing issues like thread contention, deadlocks, and performance bottlenecks in the Microservice. For more detailed information, check out our post on What Thread dumps are.
How to Capture Thread Dump from a Microservice?
Capturing thread dumps can be done using various tools and scripts such as jstack, jcmd… actually there are 9 different options to capture thread dump. One of the comprehensive and lightweight options is to use yCrash open-source script. This script not only captures thread dumps but also collects 16 essential artifacts (such as GC log, Application log, Kernel log, netstat, vmstat, heap substitute, …) from your Microservice application. When there is a performance problem it can stem from various sources, thus equipping yourself with 360° artifacts to troubleshoot the problem is a highly effective strategy.
How to Analyze Thread Dumps?
After capturing a thread dump, the next step is to analyze it. Thread dumps can be intricate and often contain thousands of lines of information, making manual analysis challenging and time-consuming. Additionally, thread dump formats can vary depending on the JVM version, vendor, and the tool used to capture them, further complicating the process.
This is where thread dump analysis tools like fastThread come in. These tools support multiple formats and can quickly parse and analyze thread dumps. By leveraging Machine Learning algorithms, fastThread can automatically detect the root cause of several performance issues, such as deadlocks, high CPU usage, or thread contention, without the need for manual inspection of complex stack traces.
Case Study: Troubleshooting an Unresponsive Microservice Application
A major travel organization in North America was facing a recurring issue in one of their critical microservices. The application would become unresponsive a few hours after it started receiving traffic. This instability posed a significant challenge for the Site Reliability Engineering (SRE) team, who struggled to identify the root cause. To gain more insight, they decided to capture a thread dump and analyze it using the fastThread tool.
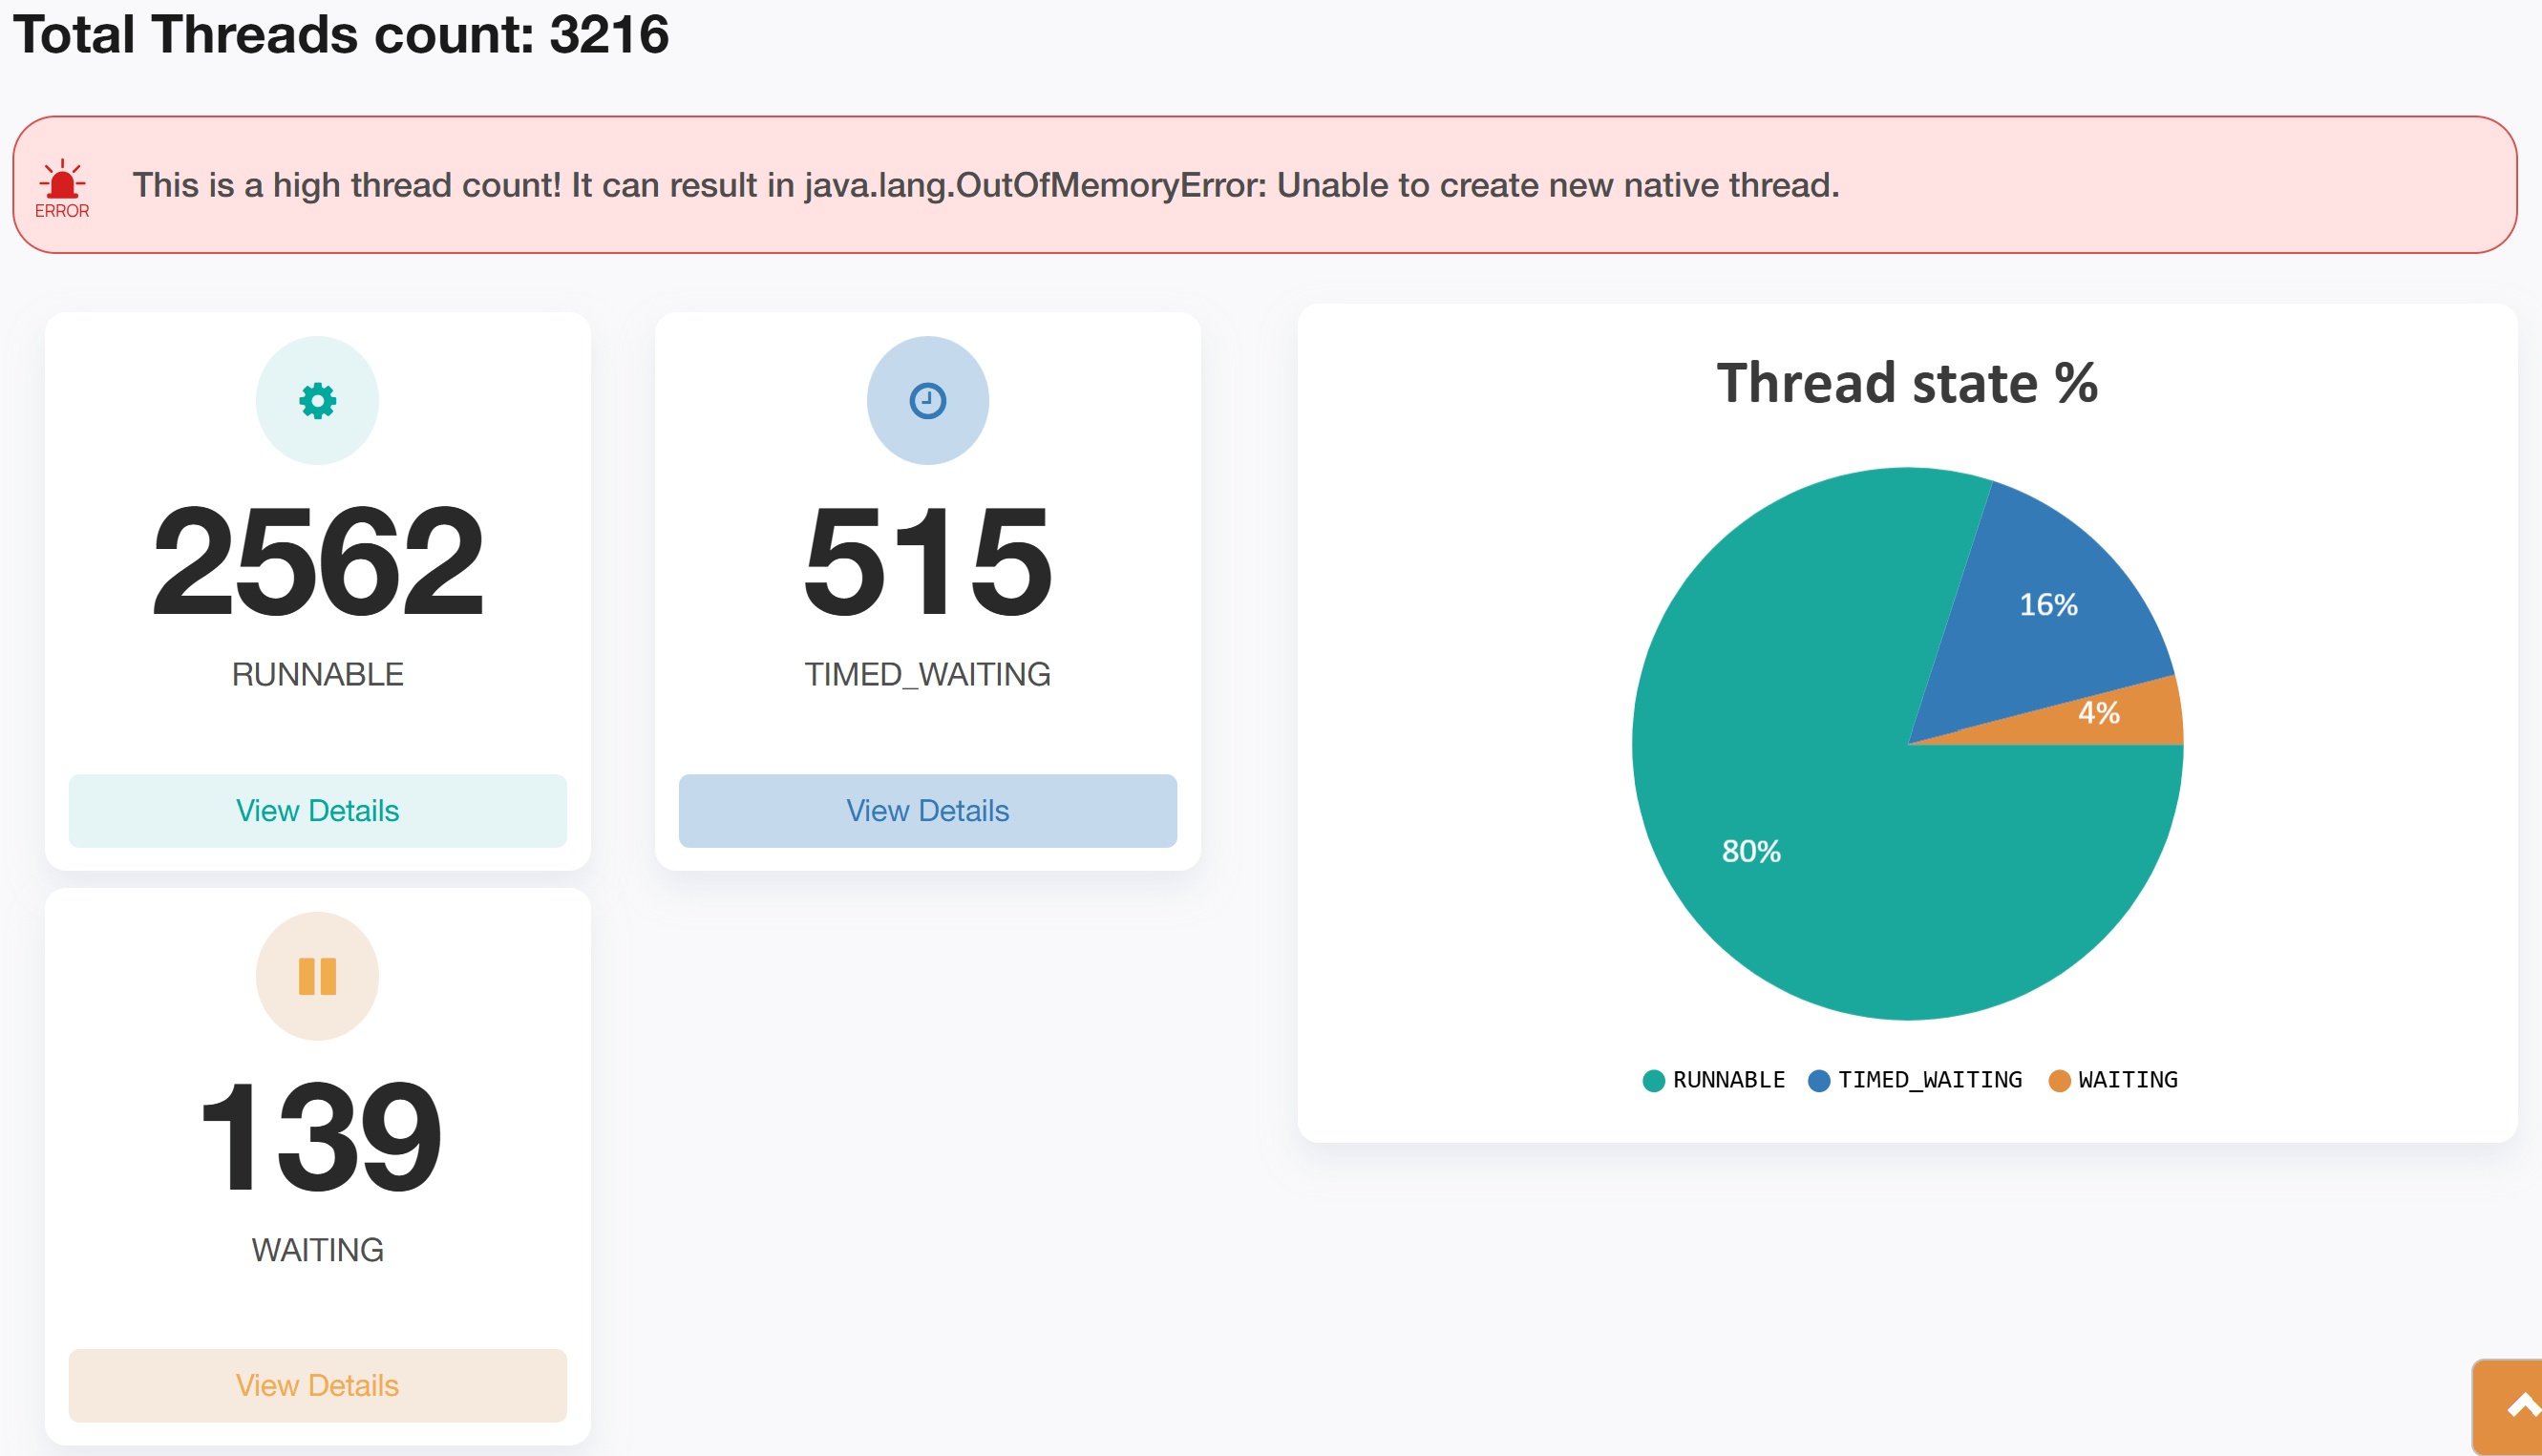
The thread dump analysis report generated by fastThread revealed a startling finding: the application had 3,216 active threads at the time of the dump, which was far above the normal threshold for this microservice. Under typical load conditions, the thread count was significantly lower, indicating an abnormal spike.
Here is the actual thread dump analysis report generated by the fastThread tool for this application. Class names in the stack trace have been anonymized for security purposes.
The fastThread tool provides a feature called ‘Repeating Stack Traces,’ which groups threads with identical stack traces together. This feature is particularly useful in performance troubleshooting because it highlights patterns where multiple threads are stuck or waiting at the same point in the code. Such clustering often points to a bottleneck in the application, as threads converge at a problematic resource or operation.
In this case, the ‘Repeating Stack Traces’ section showed that 2,319 threads (accounting for 72% of the total threads), had identical stack traces. This was a clear indication that a significant portion of the threads were being blocked or delayed by the same issue.
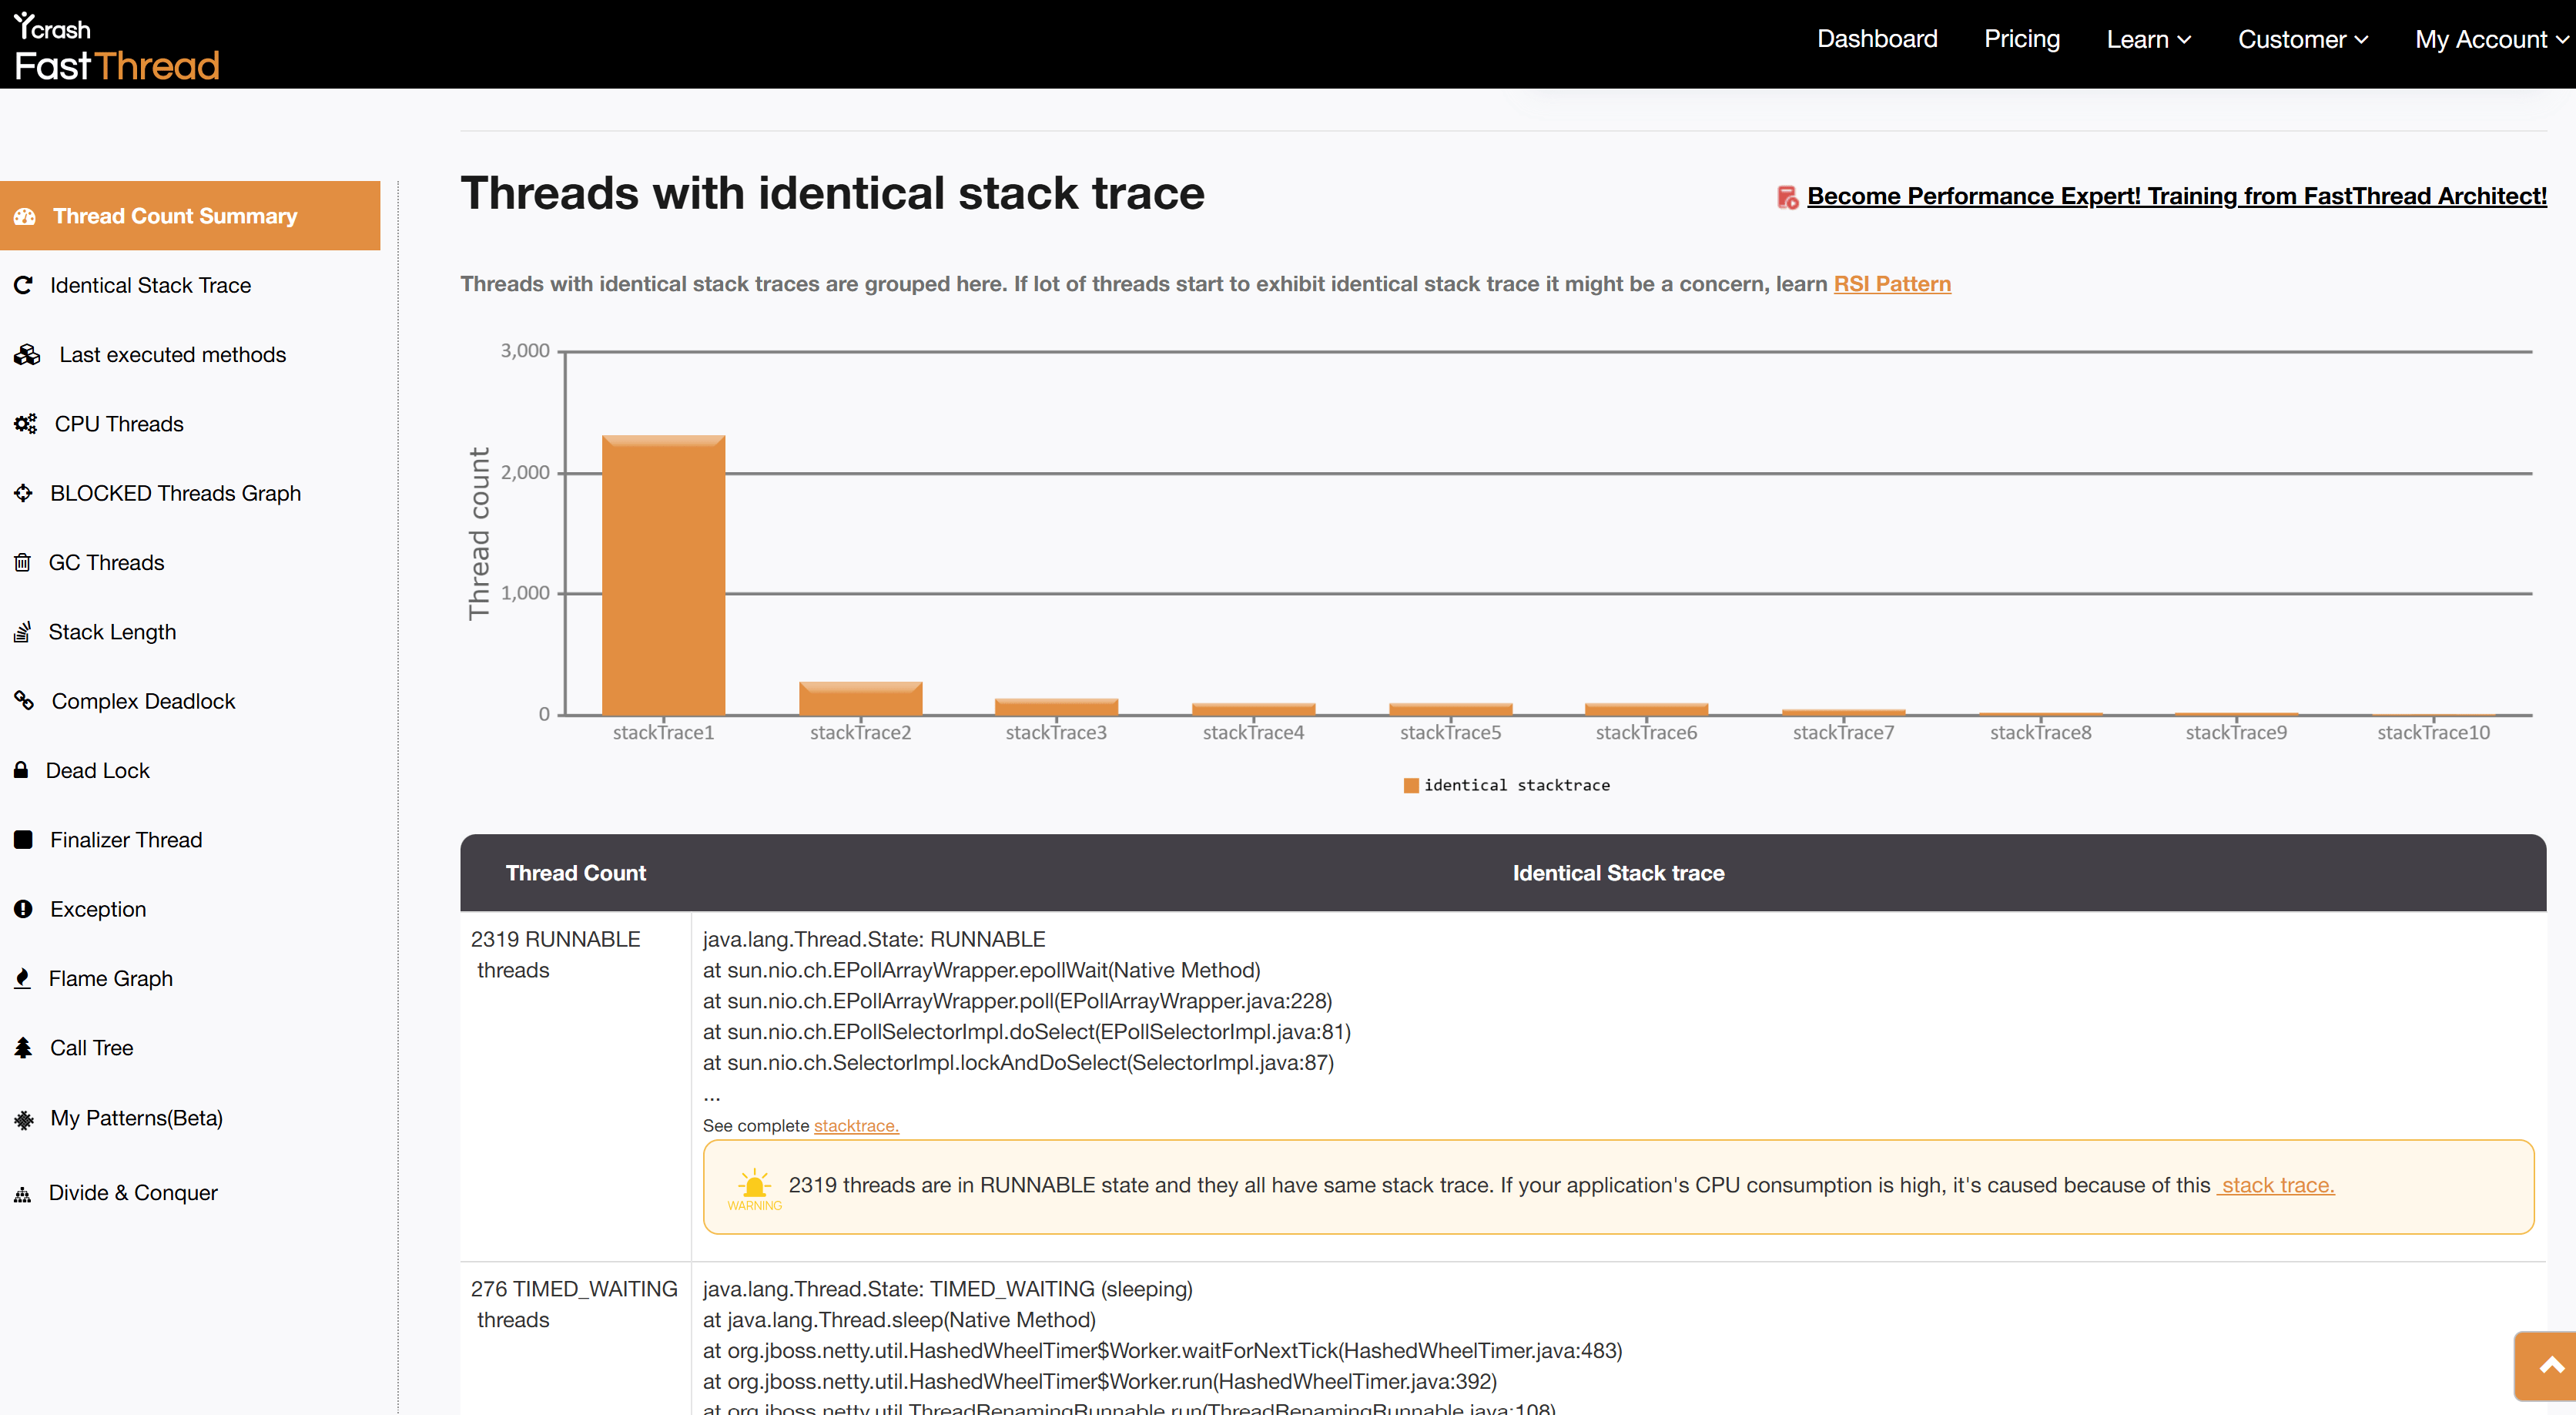
Upon examining the stack trace in detail, it became evident that these threads were being created by the DataStax driver, which the application used to connect to an Apache Cassandra NoSQL Database. The stack trace indicated that the threads were stuck at a network communication level, specifically related to a connection issue with the Cassandra database.

The root cause of this issue was traced back to a disk space shortage on one of the Cassandra nodes. As the disk space on the node ran low, it started to affect the database’s ability to handle requests efficiently. In response, the DataStax driver attempted to open additional connections and spawn more threads to manage the increasing load and network retries. This led to an excessive number of threads being created, which overwhelmed the JVM and caused the microservice to become unresponsive.
Root Cause and Resolution
The primary issue was a lack of disk space on one of the Apache Cassandra nodes. This resource constraint prevented the database from functioning properly, causing the DataStax driver to create thousands of additional threads in an attempt to manage the failing connections. This surge in thread creation ultimately resulted in the JVM running out of resources, making the microservice unresponsive.
Once the disk space issue on the problematic Cassandra node was identified, additional storage was allocated to the node. After this intervention, the microservice was able to restore normal operation, and the thread count returned to expected levels. The application became stable, and no further thread-related issues have been observed.
Conclusion
Thread dumps are a powerful tool for diagnosing performance issues in microservices architectures. By using tools like fastThread for analyzing thread dumps, you can quickly identify and resolve complex issues. This case study underscores the importance of understanding the context and underlying causes of thread-related problems, which is crucial for maintaining application performance and stability. For more thread dump analysis success stories refer here.
If you have any questions or need further assistance with microservices performance tuning, feel free to reach out or leave a comment below.

Share your Thoughts!