
Java EE architecture is used in many enterprises due to its modularity, scalability, vendor support and rich set of functionalities. Its widespread adoption powers mission-critical applications across industries. However, with such robust capabilities come the challenges of diagnosing and resolving performance issues in production environments. When Java EE applications experience bottlenecks, such as high CPU usage, slowdown, thread contention, or deadlocks – the most effective ways to troubleshoot is through thread dump analysis.
Thread dumps offer valuable insights into the internal state of a running application, capturing the status of all threads in the Java Virtual Machine (JVM). By examining thread dumps, you can quickly identify the root cause of performance problems, helping you to restore your application’s health faster. In this post, we will discuss how to capture and analyze thread dumps to efficiently diagnose and resolve performance issues in Java EE applications.
What is a Thread Dump?
A thread dump is a snapshot of all the threads running in a Java Virtual Machine (JVM) at a particular moment. It provides detailed information like thread names, states, IDs, the lines of code each thread is executing, and any locks held or waiting to be acquired. This data is invaluable for diagnosing issues like thread contention, deadlocks, and performance bottlenecks in the Java EE applications. For more detailed information on what thread dumps are, refer to this post on thread dumps.
How to Capture Thread Dump from Java EE application?
A Java thread dump can be captured by using the ‘jstack’ command line tool which is present in JDK. Here is the jstack command that you need to issue to capture thread dump:
jstack -l <pid> > <file-path>where
pid: is the Process Id of the application, whose thread dump should be captured
file-path: is the file path where thread dump will be written in to.
Capture 360° artifacts
Besides ‘jstack’ there are 8 different options to capture thread dump. One of the comprehensive and lightweight options is to use yCrash open-source script. This script not only captures thread dumps but also collects 16 essential artifacts (such as GC log, Application log, Kernel log, netstat, vmstat, heap substitute, …) from your Java EE application. When there is a performance problem it can stem from various sources, thus equipping yourself with 360° artifacts to troubleshoot the problem is a highly effective strategy.

Anatomy of a Thread Dump
A thread dump consists of two primary sections: the header and the body.
Header Section: The header provides a summary of the environment and context in which the thread dump was captured.
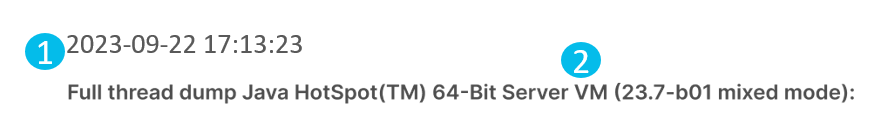
- Timestamp: The exact date and time when the thread dump was generated.
- JVM Version: Details about the Java Virtual Machine, such as whether it’s running in 32-bit or 64-bit mode, and whether it’s operating in client or server mode.
Body Section: The body contains detailed information about each thread in the application at the time of capture.

- Thread Name: The name given to the thread. Developers can use the Thread#setName() method to assign a custom name, making it easier to identify threads in the dump.
- Priority: Indicates the priority level of the thread, ranging from 1 (lowest) to 10 (highest). In cases of CPU contention, threads with higher priority may be given preference. Note that this is a suggestion to the OS, and the actual scheduling depends on the operating system’s kernel.
- Thread ID: A unique identifier assigned by the JVM to each thread within the Java process.
- Native ID: A unique identifier assigned by the operating system to manage the thread as a resource. This ID is useful when using OS-level tools like top to analyze thread behavior.
- Address Space: The memory space allocated to the thread. This is generally not necessary for routine troubleshooting.
- Thread State: Shows the current status of the thread, which can be one of the following states: NEW, RUNNABLE, BLOCKED, WAITING, TIMED_WAITING, or TERMINATED. For more detailed information, check out our video on Thread states.
- Stack Trace: The series of method calls that the thread has executed, presented in a top-down order. The top line represents the most recent method call, while the bottom line shows the earliest.
How to Analyze Thread Dumps?
Once you’ve captured a thread dump, the next step is analyzing it. Manually analyzing a thread dump can be a tedious task, as they often span thousands of lines and are filled with complex details. Additionally, thread dump formats are not standardized, they vary based on the JVM version, vendor, and the tool used for capturing them, which makes the analysis more challenging.
This is where thread dump analysis tools like fastThread can come handy. These tools can handle multiple thread dump formats and swiftly analyze the data. By leveraging Machine Learning algorithms, fastThread can automatically detect the root cause of several performance issues—such as deadlocks, high CPU utilization, thread contention, and more—without requiring you to manually sift through intricate stack traces, saving you several hours of time.
Case Study: Troubleshooting Financial Organization’s Middleware
A major financial institution in North America experienced a critical issue with its middleware application. As most of you know, middleware is considered as the center of the universe. Any downtime in the middleware will disrupt all banking channels (online banking, mobile banking, ATMs, and call centers) and lines of business.
Despite this, the middleware application suffered a serious outage. After a few hours of handling traffic, the application would become unresponsive. This instability left the Site Reliability Engineering (SRE) team struggling to pinpoint the root cause. To investigate further, they captured a thread dump and analyzed it using the fastThread tool.
The fastThread analysis revealed an alarming discovery: this Java EE application had 1,859 active threads at the time of the dump, far exceeding it’s normal thread count. Under normal load conditions, the thread count was much lower, pointing to an abnormal spike in threads.
Here is the actual thread dump analysis report generated by the fastThread tool for this application. Class names in the stack trace have been anonymized for security purposes.

A key feature of fastThread, called ‘Repeating Stack Traces’, which groups threads with identical stack traces. This feature is particularly useful in performance troubleshooting because it highlights patterns where multiple threads are stuck or waiting at the same point in the code. Such clustering often points to a bottleneck in the application, as threads converge at a problematic resource or operation. These clusters often signal a bottleneck in the system.
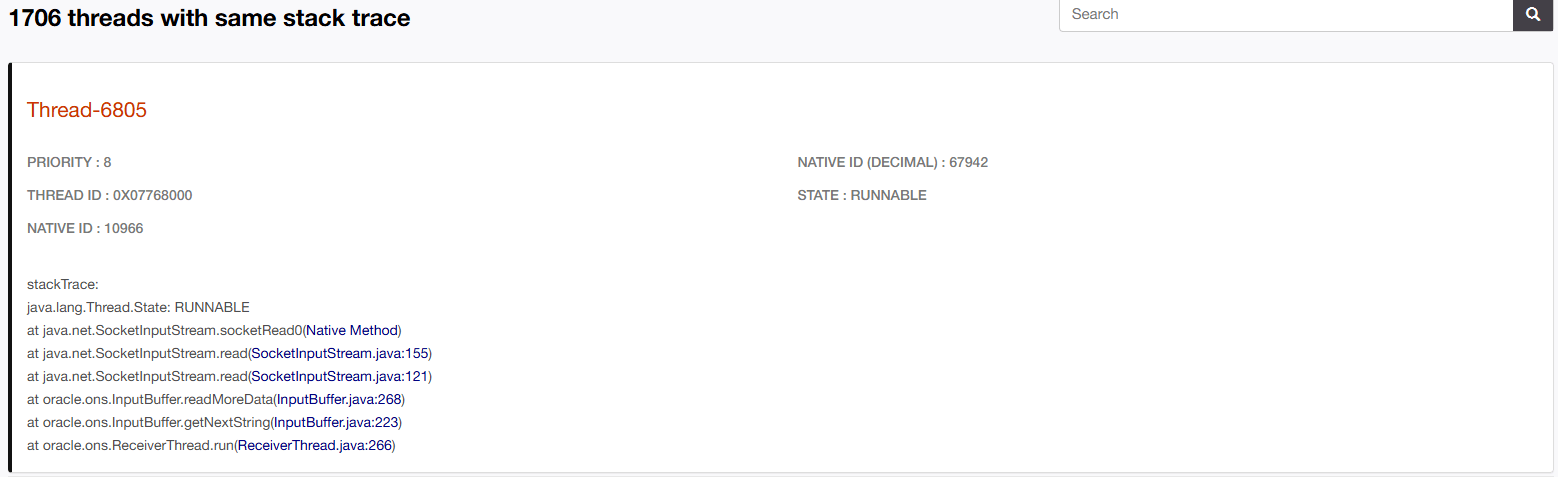
In this case, the ‘Repeating Stack Traces’ section showed that 1,706 threads (accounting for 92% of the total threads), had identical stack traces. This was a clear indication that a significant portion of the threads were being blocked or delayed by the same issue.
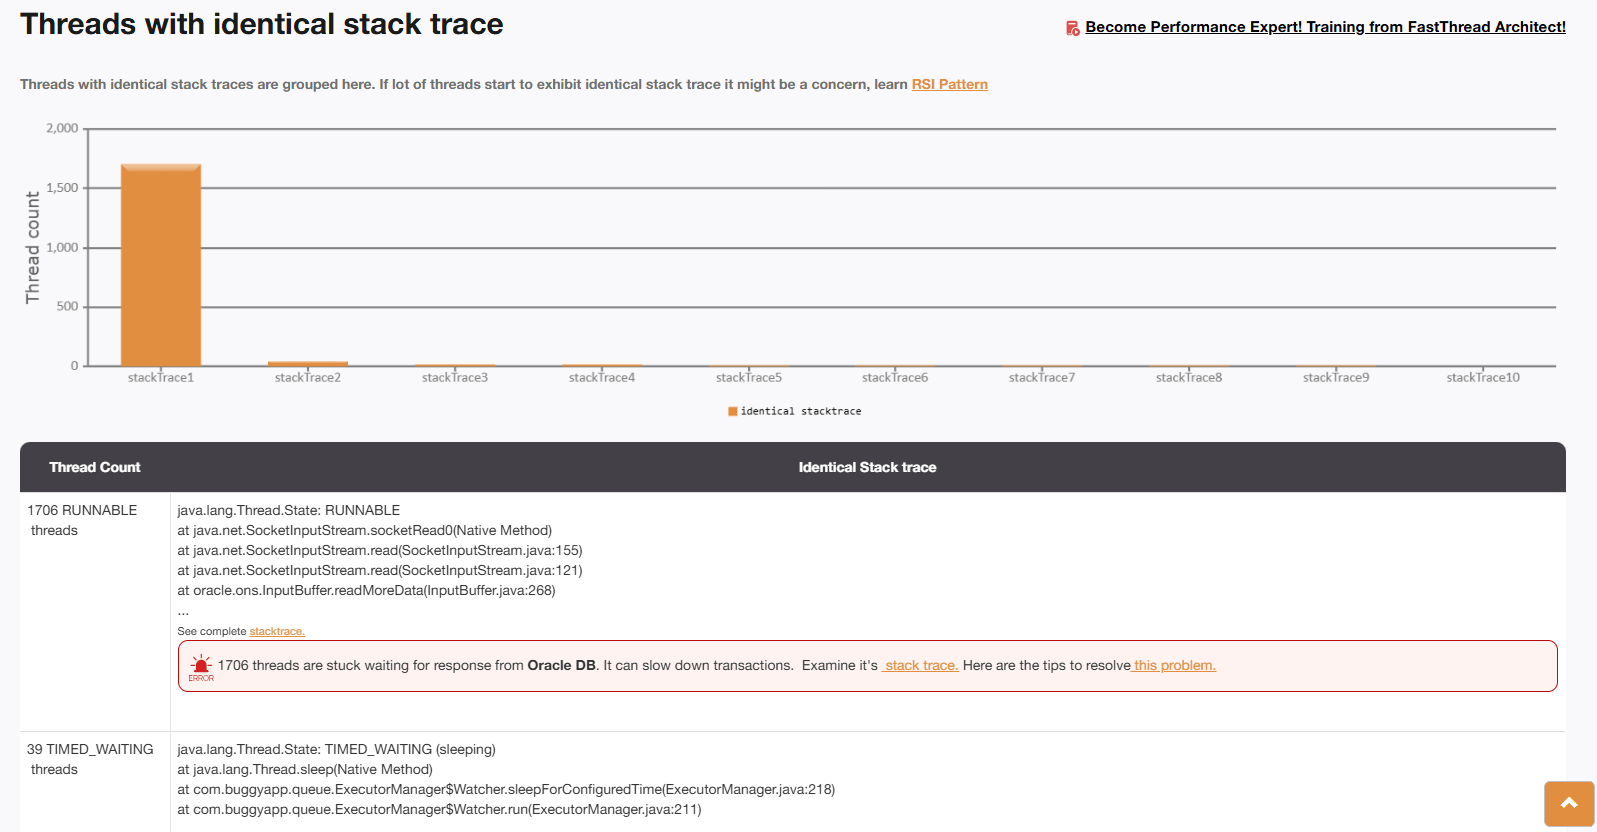
Upon closer examination, it was clear that these threads were being created by the Oracle JDBC driver. The application had enabled the ‘ons’ (Online Notification Service) flag as recommended by Oracle. This flag was supposed to improve availability by rerouting transactions to other active nodes in the Oracle RAC cluster in case of a node failure. However, due to a bug in the implementation, each backend call spawned a new thread that never terminated. This led to an overwhelming 1,706 threads, causing the application to become unresponsive.
Root Cause and Resolution
After the thread dump analysis report was shared with the database vendor, they confirmed that the issue was caused by a bug in their JDBC driver, which kept spawning new threads. The vendor resolved the issue by releasing a new version of the JDBC driver. Once the updated driver was installed, the middleware application became stable, and the problem was resolved.
Conclusion
Thread dumps are a powerful tool for diagnosing and resolving performance issues in Java EE applications. By capturing a snapshot of all active threads within the JVM, you gain valuable insight into potential performance related bottlenecks. Tools like fastThread simplify the analysis process by automatically identifying the root causes of these issues, saving you time and effort.
As seen in the case study, thread dumps can be instrumental in pinpointing complex problems that may otherwise go unnoticed, ensuring application stability and reliability in production environments. For more thread dump analysis success stories refer here.

2 Pingback